Is the branch of Mathematics which deals with the collection, presentation and analysis of data obtained from various experiments?
FREQUENCY DISTRIBUTION
Is the arranged data summarized by distributing it into classes or categories with their frequency
Example;
| Variables | 20 | 40 | 50 | 60 | 70 |
| Frequency | 2 | 7 | 5 | 4 | 3 |
edu.uptymez.com
GRAPHICAL REPRESENTATION
Is often useful to represent frequency nglish-swahili/distribution” target=”_blank”>distribution by means of diagrams.There are different types of diagrams. These are;
1. Line graph
2. Cumulative frequency curve (Ogive)
3. Circles or Pie
4. Bar chart (Histogram)
5. Frequency polygon
TYPES OF DATA
They are;
i) Ungrouped.
ii) Grouped data.
UNGROUPED DATA
Is the type of data in which each value is taken separately which represent to each other e.g. 20, 30 ,40 ,50 etc
REPRESENTATION OF UNGROUPED DATA
-Ungrouped data can be represented by;
(a) Frequency nglish-swahili/distribution” target=”_blank”>distribution table
(b) Cumulative frequency nglish-swahili/distribution” target=”_blank”>distribution table
(c) Frequency histogram
(d) Frequency polygon
(e) Frequency curve
(f) Cumulative frequency nglish-swahili/distribution” target=”_blank”>distribution curve (O gives)
A.FREQUENCY DISTRIBUTION TABLE
Is the table of values with their corresponding frequencies
For instance;
| Values | 20 | 30 | 40 | 50 | 60 | 70 |
| frequency | 2 | 3 | 5 | 6 | 2 | 1 |
edu.uptymez.com
B. CUMULATIVE FREQUENCY TABLE
Is the table of values with their corresponding cumulative frequencies
For instance;
| Values | 20 | 30 | 40 | 50 | 60 | 70 |
| frequency | 2 | 5 | 10 | 16 | 18 | 19 |
edu.uptymez.com
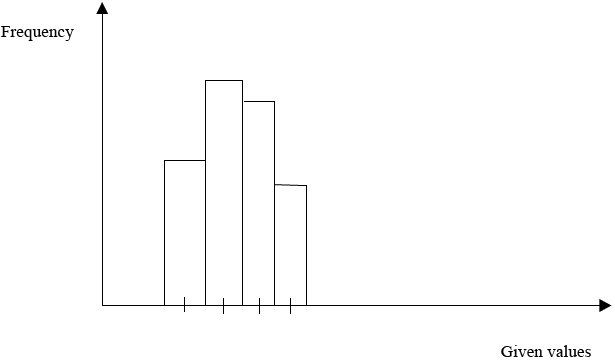
C. FREQUENCY HISTOGRAM
Is the graph which is drawn by using frequency against given values.
Example
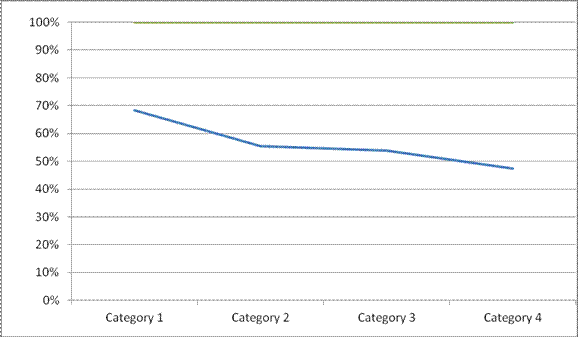
D.FREQUENCY POLYGON
Is the polygon which is drawn by using the corresponding points of frequencies against a given value.
Example
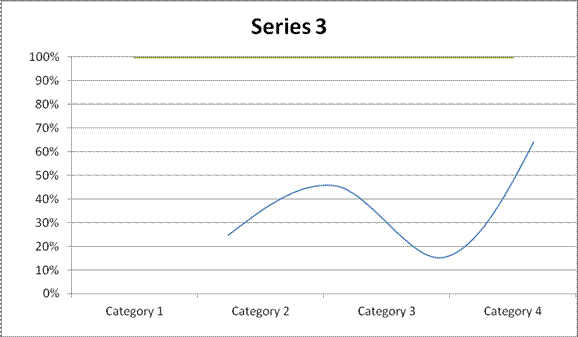
E. THE FREQUENCY CURVE
Is the curve which is drawn by joining (free hand) the corresponding points of frequency against given values.
Example
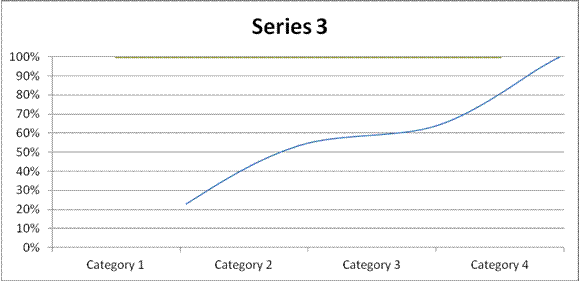
F.CUMULATIVE FREQUENCY CURVE (O GIVE)
Is the curve of cumulative frequency against given values
Example
MEASURES OF CENTRAL TENDENCY
These are;
I) Mean
ii) Mode
iii) Median
iv) Harmonic mean
v) Geometric mean
1. MEAN 
Is obtained by adding together all the items and dividing by the number of items.
Mean ( ) =
) = 
2. MODE
Is the number (value) which occur most frequently
For instance
i) Given 2,3,5,5,6,7,7,7,9
→7 has a frequency of 3
→Hence 7 is the mode
ii) Given 1,2,3,4,5,5,6,7,
→then 4 and 5 are the mode their frequency is 2
iii) Given 2, 33, 4, 5, 6, 7= there is no mode at all
3. MEDIAN
Is the middle number (value) when the data is arranged in the order of site.
N.B
I) When the total number of items is ODD say “N” the value of 
Items give the mode.
II) When the total number of items is EVEN, say “N” there are two middle items, then the mean of the values of ½ Nth and (½ N+1)th item is the median
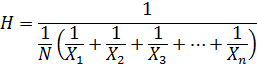
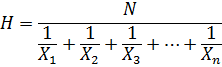
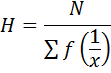
4. HARMONIC MEAN
Is the reciprocal of arithmetic mean of their values.
– If it is harmonic mean
Then 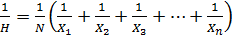
For value of x1, x2 ,x3…xn with the frequency, f1,f2, f3+…….. fn respectively
The harmonic mean is given by

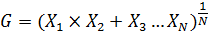
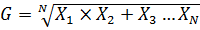
5. GEOMETRIC MEAN
For the values of x1, x2, x3, x4,………xn then the geometric mean is given by

Examples
Find the mean of 20, 22, 25, 28, and 30
Solution
Given 20, 22, 25, 28, 30
∑f =5
Mean ( ) =
) = 
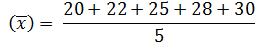
( ) =25
) =25
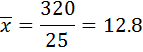
2. Find the mean of the following;
| No | 8 | 10 | 15 | 20 |
| f | 5 | 8 | 8 | 4 |
edu.uptymez.com
Solution
Consider the table below;
| No | F | Fx |
| 8 | 5 | 40 |
| 10 | 8 | 80 |
| 15 | 8 | 120 |
| 20 | 4 | 80 |
edu.uptymez.com
∑f=25 ∑ f(x)= 320
Mean ( ) =
) = 
3. Find the median of 6, 8, 9, 10, 11, 12 and 13.
Solution
Given 6, 8, 9, 10, 11, 12, 13
N=7
Position = 
= 
= 4th
Median is 10
4. Find the mode of the following items
0,1,6,7,2,3, 7,6,6,2,6,0, 5, 6, 0
Solution
From the given data 6 has a frequency of 5
→6 is the mode
5. Find the geometric mean of 4,16,8
Solution
Number 4,8,16
N=3
From
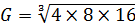
G= 8
→Geometric mean is 8
6. Calculate the harmonic mean of the data 4,8,16
Solution
Numbers4, 8, 16
N=3
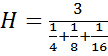
H = 6.857
The harmonic mean =6.857
B.MEASURES OF DISPERSION (Variability)
These are;
i) Variance
ii) Standard deviation
iii) Mean deviation
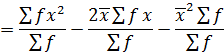
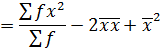
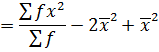
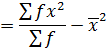
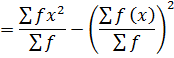
1. VARIANCE
This is given by;
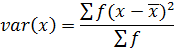
The formula is used for ungrouped data
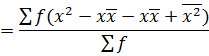
Also,
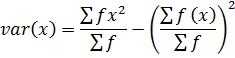
Var(x) = 
2. STANDARD DEVIATION
This is given by;
S.D =
S.D=
S.D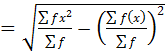
3. MEAN DEVIATION
This is given by
M.D =
Also f =1
M.D =
Examples
7. From the nglish-swahili/distribution” target=”_blank”>distribution 1, 2, 3, 4, 5 find variance
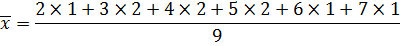
8. Given the nglish-swahili/distribution” target=”_blank”>distribution 2, 3, 4, 5, 6, 7, 4, 5, 3 find
a) Variance
b) Standard deviation
c) Mean deviation
Solution
Consider the nglish-swahili/distribution” target=”_blank”>distribution table
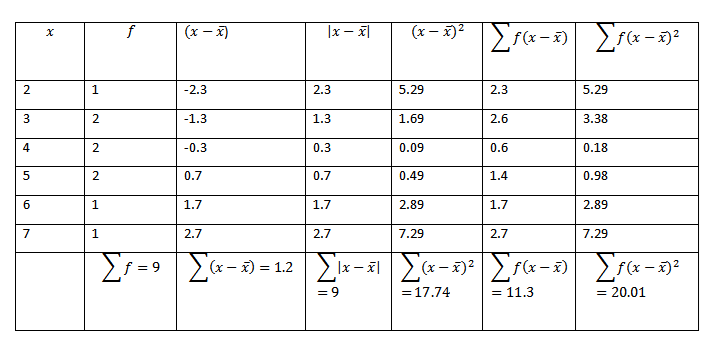

Variance
Form
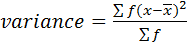

Var(x) = 2.223.
b) Standard deviation
S.D =
S.D =
S.D = 1.491
c). Mean deviation
=
= 1.25556