Definition
-is a branch of mathematics dealing with the study of method of collecting, organizing, analyzing, presenting and nglish-swahili/interpreting” target=”_blank”>interpreting numerical details to reach conclusions.
Frequency nglish-swahili/distribution” target=”_blank”>distribution
Is a number of times each data point
Example 1
1. Make a frequency table from the following data from the followings data of ages 10 students
14, 15, 16. 14, 17, 15, 16, 13,

2. In mathematics test the following marks were obtained;
48 , 47,42, 67, 73, 50, 76 ,47, 44, 44, 57, 58, 54, 45, 58, 56 , 66, 67, 45, 43, 71, 48, 64, 52, 42, 54, 62, 32, 49, 34, 35, 46, 89, 37, 47, 54, 45, 60, 64, 44,.
If the class size of the class interval is 8 group the works starting with the interval 32-39 and draw the frequency nglish-swahili/distribution” target=”_blank”>distribution table.
solution
|
Mark |
Frequency |
|
88-95 |
1 |
|
80-87 |
0 |
|
72-79 |
2 |
|
64-71 |
6 |
|
56-63 |
6 |
|
48-55 |
8 |
|
40-47 |
13 |
|
32-39 |
4 |
|
|
n=40 |
edu.uptymez.com
Example
From example below find the class mark of the class interval 88 – 95 and 80 – 87
class mark:  and
and 
 and
and 
= 91.5 and 83.5
Class limit ; example in class interval 88 – 95
88 is the class lower limit
95 is the class upper limit
CLASS REAL LIMITS
class lower real limit – is the number obtained by subtracting 0.5 from a class lower limit e.g. 88-0.5= 87.5
class upper real limit obtained by adding 0.5 to the upper class limit eg, 95 + 0.5 = 95.5
class size- is the value obtained by the difference between the upper real limit and the lower real limit
example .
from class interval 88-95 and 31-35
find the class size
solution:
Lower class real limit = 88 – 0.5 = 87.5
Upper class real limit = 95+ 0.5 = 95.5
Class size = 95.5 – 87.5 = 8
Lower class real limit = 31 – 0.5 = 30.5
Upper class real limit = 35+ 0.5 = 35.5
Class size = 35.5– 30.5= 5
Exercise 1:
(1).In biology class test the following marks when obtained;
54,54,40,55,54,43,73,34, 75, 47, 35, 45,73,46,31,43,47,35,35,60,67,51,44,48,55,45,50,37,51,36
By grouping the marks in class interval 20-29 ,30-39, 40-49, etc construct the the frequency
Solution:
DISTRIBUTION TABLE
|
Marks |
Frequency(f) |
|
20 -29 |
0 |
|
30 –39 |
7 |
|
40 -49 |
10 |
|
50 -59 |
8 |
|
60 -69 |
2 |
|
70 -79 |
3 |
|
|
N = 30 |
edu.uptymez.com
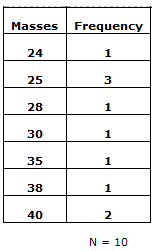
(2) The following data represent the masses of 10 people in kg. Construct the frequency nglish-swahili/distribution” target=”_blank”>distribution table for these people
30 25 35 28 38 40 25 25 40 24
Solution:
(3). The following is a set of marks on a geography examination presents the frequency nglish-swahili/distribution” target=”_blank”>distribution table with class intervals, real limit, class marks, interval size starting with the interval 8-15 at the bottom
Solution:
|
class interval |
Real limits |
class marks |
interval |
f |
|
88-95 |
87.5-95.5 |
91.5 |
8 |
3 |
|
80-87 |
79-87.5 |
83.5 |
8 |
3 |
|
72-79 |
71.5-79.5 |
75.5 |
8 |
6 |
|
64-71 |
63.5-71.5 |
67.5 |
8 |
3 |
|
56-63 |
55.5-63.5 |
59.5 |
8 |
6 |
|
48-55 |
47.5-55.5 |
51.5 |
8 |
4 |
|
40-47 |
39.5-47.5 |
43.5 |
8 |
7 |
|
32-39 |
31.5-39.5 |
35.5 |
8 |
4 |
|
24-31 |
23.5-31.5 |
27.5 |
8 |
8 |
|
16-23 |
15.5-23.5 |
19.5 |
8 |
2 |
|
8-15 |
7.5-15.5 |
11.5 |
8 |
4 |
|
|
|
|
|
n=50 |
edu.uptymez.com
(4). Fill in the blank columns
Distribution of 100 math s examination score
|
class interval |
real limit |
class marks |
interval |
f |
|
95-99 |
94.5-99.5 |
97 |
5 |
3 |
|
90-94 |
89.5-94.5 |
92 |
5 |
7 |
|
85-89 |
84.5-89.5 |
87 |
5 |
9 |
|
80-84 |
79.5-84.5 |
82 |
5 |
13 |
|
75-79 |
74.5-79.5 |
77 |
5 |
20 |
|
70-74 |
69.5-74.5 |
72 |
5 |
23 |
|
65-69 |
64.5-69.5 |
67 |
5 |
17 |
|
60-64 |
59.5-64.5 |
62 |
5 |
8 |
|
|
|
|
|
|
|
|
|
|
|
N=100 |
edu.uptymez.com
Note:
Class real limits are also known as class boundaries
GRAPHS OF FREQUENCY DISTRIBUTIONS:
HISTOGRAMS
Histograms of frequency nglish-swahili/distribution” target=”_blank”>distribution are rectangular figures plotted with class marks against frequency . The width of the histogram equal to the class size.
Example:
1. Draw a histogram of 100 mathematics examination scores in the table below
|
class interval |
class mark |
|
|
95-99 |
97 |
3 |
|
90-94 |
92 |
7 |
|
85-89 |
87 |
9 |
|
80-84 |
82 |
13 |
|
75-79 |
77 |
20 |
|
70-74 |
72 |
23 |
|
65-69 |
67 |
17 |
|
60-64 |
62 |
8 |
edu.uptymez.com
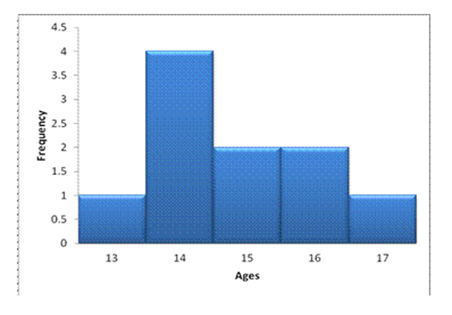
3. . 2. Use the following nglish-swahili/distribution” target=”_blank”>distribution table below to draw a histogram
|
age |
Frequency |
|
13 |
1 |
|
14 |
4 |
|
15 |
2 |
|
16 |
2 |
|
17 |
1 |
|
|
|
edu.uptymez.com
Solution
FREQUENCY POLYGON
Is the line graph of class frequency plotted against class marks
Steps ;
1. 1. Add one interval below the lowest interval and one above the highest interval and assign them as zero frequency.
2. 2. Plot a point and join them by straight lines
Example
1. Draw a frequency polygon from the following data.
|
|
|
|
|
c-interval |
c-mark |
|
|
100-104 |
102 |
0 |
|
95-99 |
97 |
3 |
|
90-94 |
92 |
7 |
|
85-89 |
87 |
9 |
|
80-84 |
82 |
13 |
|
75-79 |
77 |
20 |
|
70-74 |
72 |
23 |
|
65-69 |
67 |
17 |
|
60-64 |
62 |
8 |
|
55-59 |
57 |
0 |
edu.uptymez.com
EXERCISE
1. The following table shows female death between 0 and 34 years to the nearest numbers represent this information by
A) Histogram
B) Frequency polygon
Expected death of female per 100 women
|
|
|
|
|
ages |
F(death risks) |
age |
|
0-4 |
340 |
2 |
|
5-9 |
95 |
7 |
|
10-14 |
55 |
12 |
|
15-19 |
60 |
17 |
|
20-24 |
95 |
22 |
|
25-29 |
110 |
27 |
|
30-34 |
120 |
32 |
|
35-39 |
125 |
37 |
|
N=1000 |
|
|
|
|
|
|
edu.uptymez.com
Solution:
A) Histogram
B) FREQUENCY POLYGON
2. Table below show the nglish-swahili/distribution” target=”_blank”>distribution of marks obtained by 110 students in two different monthly tests. Draw the frequency polygon on the same chart
|
marks |
marks |
||
|
21-30 |
4 |
21-30 |
2 |
|
31-40 |
7 |
31-40 |
12 |
|
41-50 |
10 |
41-50 |
15 |
|
51-60 |
5 |
51-60 |
4 |
|
61-70 |
3 |
61-70 |
3 |
|
71-80 |
1 |
71-80 |
4 |
|
|
|
|
|
|
|
N=40 |
|
N=40 |
edu.uptymez.com
CUMULATIVE FREQUENCY CURVE (ORGIVE)
– Cumulative frequency is the sum of all the frequency less than or equal to a given mark or class interval
– To calculate the cumulative frequency start with the smaller upper real limit
– Add the frequency of the smallest interval to the next interval downwards or up wards depending on whether the data is arranged in descending or
ascending order
Note: The last entry in the cumulative frequency is always equal to the total number of observations
– Plot upper real limit against class marks.
– Join adjacent points by a free hand.
EXAMPLES
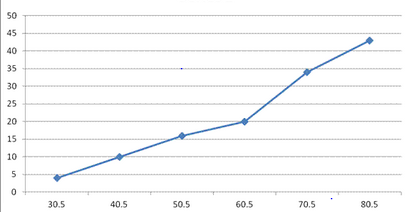
1. Draw an orgive for the scores data below.
|
score |
f |
|
70-74 |
16 |
|
65-69 |
12 |
|
60-64 |
14 |
|
55-59 |
10 |
|
50-54 |
8 |
|
45-49 |
18 |
|
40-44 |
6 |
|
35-39 |
4 |
|
30-34 |
2 |
|
|
|
|
|
N=90 |
edu.uptymez.com
Solution;
THE CUMULATIVE FREQUENCY DISTRIBUTION,
|
Score |
cumulative frequency |
|
|
less than 34.5 |
2 |
2 |
|
less than39.5 |
4 |
6 |
|
less than 44.5 |
6 |
12 |
|
less than 49.5 |
18 |
30 |
|
less than 54.5 |
8 |
38 |
|
less than 59.5 |
10 |
48 |
|
less than 64.5 |
14 |
62 |
|
less than 69.5 |
12 |
|
|
less than 74.5 |
16 |
90 |
edu.uptymez.com
N =90
2. Motor vehicle company tested 100 cars to see how far they could travel on 10 litres of petrol. Draw the cumulative frequency curve for this company
|
distance in km |
100-109 |
110-119 |
120-129 |
130-139 |
140-149 |
|
numbers of car |
5 |
15 |
25 |
35 |
20 |
edu.uptymez.com
solution
|
distance in km |
f |
cum. F |
|
less than 109.5 |
5 |
5 |
|
less than 119.5 |
15 |
20 |
|
less than 129.5 |
25 |
45 |
|
less than 139.5 |
35 |
80 |
|
less than 149.5 |
20 |
100 |
|
|
|
|
|
|
|
N=100 |
edu.uptymez.com
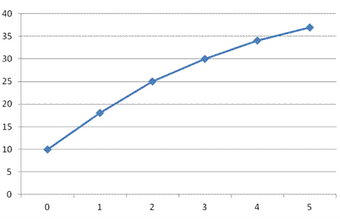
3. Platform in each square metre of a lawn were counted and recorded as follows. Draw an orgive for the platform
|
no.of plat forms |
f |
c. Frequency |
|
0 |
10 |
10 |
|
1 |
8 |
18 |
|
2 |
7 |
25 |
|
3 |
5 |
30 |
|
4 |
4 |
34 |
|
5 |
5 |
37 |
|
|
N = 37 |
|
edu.uptymez.com
REVISION EXERCISE
1. 1. The ages of the 22 players in a football match were recorded in the following
17 18 15 16 16 16 18 15 18 15 15 18 18 15 16 17 15 16 17 15 15 16 15 18 15
Express the data in a frequency table.
Solution:
|
AGES |
FREQUENCY |
|
15 |
10 |
|
16 |
5 |
|
17 |
2 |
|
18 |
5 |
|
|
N = 22 |
edu.uptymez.com
2. 2. The examination marks of 45 students are,
65 58 71 62 64 35 72 32 64 46 59 82 73 76 64 63 75 71 61 36 64 80 61 64 76 64 60 68 48 35 92 73 46 24 35 43 30 50 70 40 46 64 24 28
A)Make a frequency nglish-swahili/distribution” target=”_blank”>distribution using class interval 21-30, 31-40, 41-50,
Solution:
|
c-interval |
|
|
21-30 |
4 |
|
31-40 |
6 |
|
41-50 |
6 |
|
51-60 |
4 |
|
61-70 |
14 |
|
71-80 |
9 |
|
81-90 |
2 |
|
|
n=45 |
edu.uptymez.com
B) Draw cumulative frequency curve
Solution:
3. 3. Two plot A and B were treated with different families. The frequency number of potatoes on on samples of 100 plants on each plot are shown below
|
no.of potatoes |
3 |
8 |
13 |
18 |
23 |
28 |
33 |
38 |
|
plot A |
1 |
26 |
28 |
27 |
5 |
8 |
3 |
2 |
|
plot B |
17 |
28 |
30 |
14 |
3 |
6 |
2 |
0 |
edu.uptymez.com
Draw a histogram for plot B.
Plot B
4. In a certain examination the result were as follows;
3 student got marks between 0and 10
5 students got marks between 10 and 15
6 students got marks between 20 and 40
4 students got marks between 30 and 40
2 students got marks between 40 and 50
Construct a histogram
5] final score of history examination were recorded as shown in table below
|
score |
c- mark |
|
|
50-54 |
1 |
52 |
|
55-57 |
2 |
57 |
|
60-64 |
11 |
62 |
|
65-69 |
10 |
67 |
|
70-74 |
13 |
72 |
|
75-79 |
12 |
77 |
|
80-84 |
21 |
82 |
|
85-89 |
6 |
87 |
|
90-94 |
9 |
92 |
|
95-99 |
4 |
97 |
edu.uptymez.com
A) What is the size of class intervals?
Solution:
5 is the size of class intervals .
B)Draw a histogram to represent the scores .
Solution: