A relation associates an element of one set with one or more elements of another set.
If ”a”
is an element from set A which associates another element ”b” from set B, then the elements can be written in an ordered pairs as (a,b)
Thus we can define a relation as a set of ordered pairs.
Some relations are denoted by letter R; in set notation a relation can be written as
R = {(a, b): a is an element of the first set, b is an element of the second set}
Example of a relation
1. 1. Mwajuma is a wife of Juma.
2. 2. Amina is a sister of Joyce.
3. 3. y = 2x + 3
4. Juma is tall, Anna is short. (Not a relation)
NOTE If the relation R defines the set of all ordered pairs (x,y) such that .
y = 2x + 3 this can be written symbolically as
R = {(x, y): y=2x +3}
PICTORIAL REPRESENTATION OF RELATIONS
Relation can be represented pictorially;
i) Arrow diagram.
ii) Cartesian graph.
Arrow diagram
An arrow diagram (arrow gram or arrow graph) is a representation of a relation between sets by using the arrows.
Example:
1. Show the relation “is less than or equal to”between the members of the set {1, 2, 3, 4}, by using arrow diagram.
Solution:

R = is less than or equal to
Note: The arrow indicates that one element of one set relates to one or more elements off the other set.
The element of a set which mapped onto another set is called the Domain of a relation. The onto set is called the Range of a relation.
 The elements of set A above are called the domains and those of set B are called the range.
Also we use  to mean “set A is mapped onto B”
Example 1
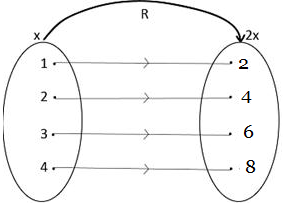
If x  2x, We mean”x is mapped onto 2 times x”.
When x is known we can select values of x as
x = 1, 2, 3, 4, 5 so the relation can be written as:-
Example 2
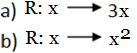
Given that  where A = {-1, 0, 2, 3, 4}. Draw a pictorial representation of the relation.
Solutions
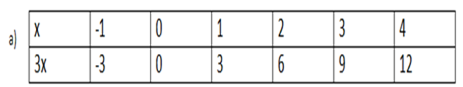
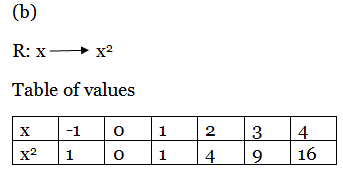
(a) R: x → 3x
Table of values
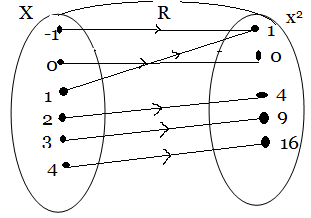
Pictorial representation
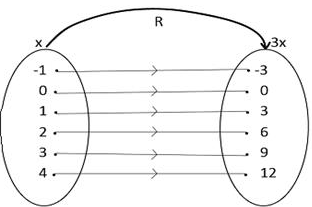
Pictorial representation is
Domain and Range of a relation
Consider a relation R which is a set of all ordered pairs (x, y). The Domain and the range of R can be defined as follows.
Domain of R = {x: (x, y) belongs to R for some y}
Range of R = {y: (x, y) belongs to R for some x}
Note: x is called the independent variable.
y is the dependent variable.
Examples
1. 1. Given that the relation R ={(x, y): y is a husband of x},find the domain and range of R
Solution
Domain of R = {all wives}
Range of R = {all husbands}
2. 2. Find domain and range of the relation
R = {(0, 2), (0, 4), (1, 2), (3, 5)}
Solution:
Domain of R = {0, 1, 3}
Range of R = {2, 4, 5}
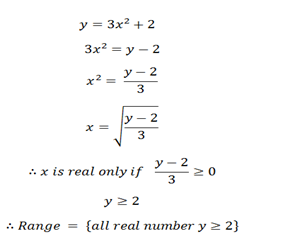
3. 3. Find the range and domain of relation of
y = 3x2 + 2
Solution:
Domain = {all real numbers x}
To find the range, make x the subject.
Graphs of a relation
Graph of a relation is another way of representing a relation. T he graph is drawn in the Cartesian plane and can also be called Cartesian graph.
Examples:
1. 1. Draw the sketch of the relation:-
R = {(x, y): y = 2x}, state domain and range
Solutions:-
Table of values
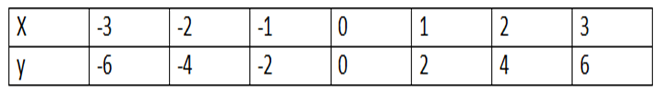
The graph can be obtained by plotting the ordered pairs in the x-y plane.
Domain of R={ all real numbers}
Range of R= {all real numbers}
2. Draw the graphs of the relations

Table of values for x = y
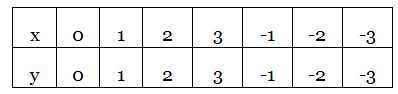
Table of values x+y=0
y = -x
|
x |
0 |
1 |
2 |
3 |
-1 |
-2 |
-3 |
|
y |
0 |
-1 |
-2 |
-3 |
1 |
2 |
3 |
edu.uptymez.com

Note
In sketching the graph of a relation of inequalities we use
1. Dotted line (——) for < and >
Solid line ( _____ ) for =, ≤ and ≥
We always shade the required region for the inequalities graph
Example
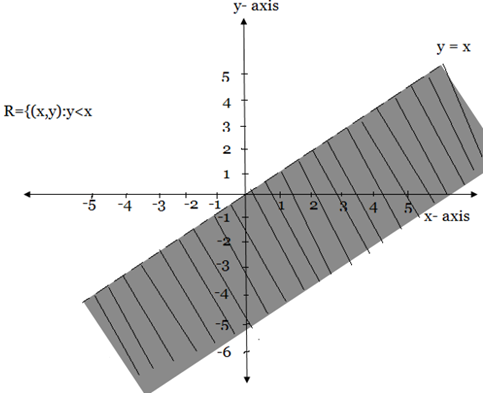
Draw the graph for the relation

Solution
The graph can be sketched as a graph of y=x
Some points belong to the relation R = {(x , y): y < x} are {(2,1), (4,3), (-2,-3), (-1,-4)}
The graph is

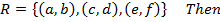
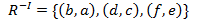
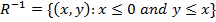
THE INVERSE OF THE RELATION
The inverse of the relation as R-1 can be obtained by reversing the order in all of the ordered pairs belonging to R.
i.e If
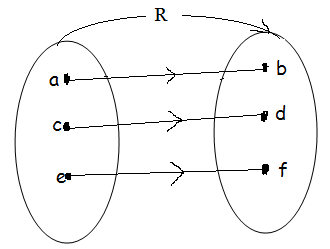
The pictorial representation for  can be obtained from the picture of R by reversing the direction of all the arrows
Pictorial representation of R
Pictorial representation of R-1
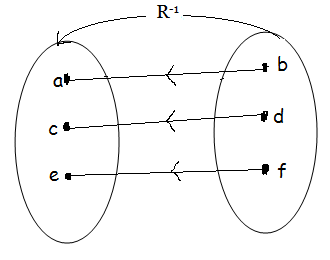
The domain in R becomes the Ranges of 

Range of 
The inverse of the above relation can also be found by first writing x in terms of y and then interchanging the variables. Therefore (x, y) becomes (y,x) in the inverse relation.
Example
1. 1. Given the relation 
(a) Find the inverse of R
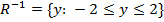
(b) Find the domain and range of 
Solution


Interchange the variables and make y the subject


(b). 

2.2. Given the relation 

Solution
The inverse of 
Write x in terms of y


GRAPHS OF THE INVERSE OF THE RELATION
Consider the relation 
Its inverse is 
In this case R is the relation less than for all real numbers,
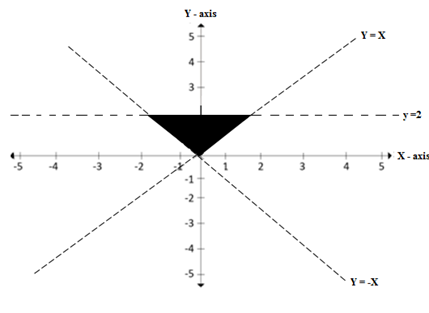
The graph of R  and
and 
Are shown as shaded region below
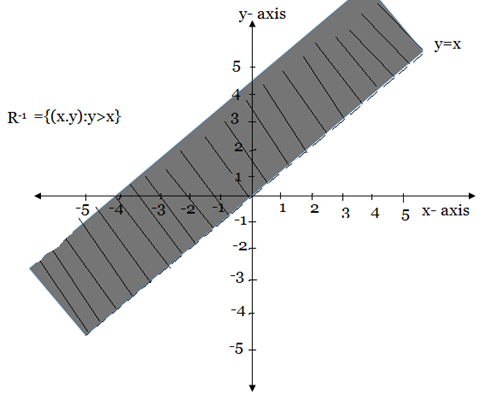
Note: The graph of  for any relation can be obtained by reflecting the graph of R about the line y=x
Thus we can draw the graph of  when R is given by first drawing R and then flecting it about the line y = x
Examples
1. Draw the graph of the inverse of 
Find its Domain and range
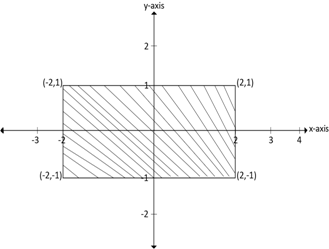
2. Draw the graph of the inverse of the relation shown in the figure below. Find its domain and range
Solutions for question 1
The domain and range of  is the intersection of the domain of the two given relations
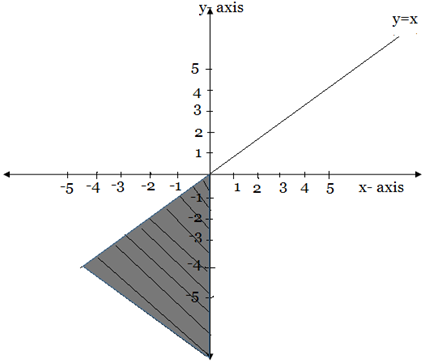
Solution for question 2
By using the coordinate on the boundary of R we have


Use the ordered pair to plot the graph of 
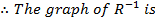
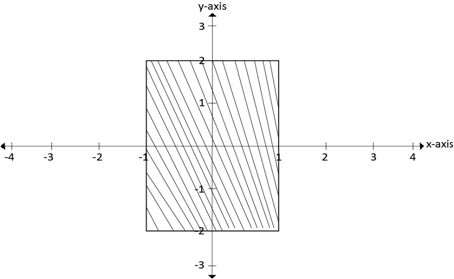
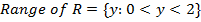
Domain of 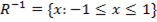
Range of