Is the study or the methods of collecting, summarizing and presenting data and nglish-swahili/interpreting” target=”_blank”>interpreting the information.
MEASURES OF CENTRAL TENDENCY
1. Mean
2. Median
3. Mode
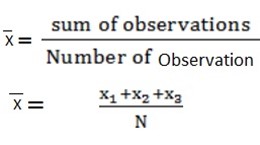
MEAN “X”
Is obtained by adding up all the data values then divide by the number of characters.
I.e.
i.e.  =mean
=mean
x1+x2+x3………. Sum of observations
N =number of observation
Example
1. Find mean score from the following scores of biology test 10, 25, 45, 15,63 42,7

= 
 = 29.57
When the data is given with frequency or in grouped data;
 =
= or
or 
f= frequency
∑= summation
2. Find the mean number of children per family from the following table
| No. of children [x] | 0 | 1 | 2 | 3 | 4 | 5 | 6 | 7 | 8 |
| No. of families [f] | 3 | 6 | 7 | 8 | 10 | 12 | 8 | 4 | 2 |
edu.uptymez.com
Solution
Finding the mean of the numbers in the table below;
| No. of children [x] | No. of families [f] | fx |
| 0 | 3 | 0 |
| 1 | 6 | 6 |
| 2 | 7 | 14 |
| 3 | 8 | 24 |
| 4 | 10 | 40 |
| 5 | 12 | 60 |
| 6 | 8 | 48 |
| 7 | 4 | 28 |
| 8 | 2 | 16 |
| Total | 60 | 236 |
edu.uptymez.com
 =
=  =
= 
 = 3.93
Exercise
1. Football club has the following number of goals scored against them 0,1,0, 2, 9,0 , 1, 2,1. What is the mean number of goals scored against them?
Solution
 =
=
 =
= 
 = 1.77
2. In a class of 30 girls the mean mass was 50kg calculate the total mass of the class.
Solution
 =50
=50
N =30
 =
= 
 =
= 
30 x 50 =  x 30
x 30
∑fx = 1500kg
MEAN OF THE GROUPED DATA
1. The table below shows a nglish-swahili/distribution” target=”_blank”>distribution of 100 students find the mean mark.
| Class interval | Class mark [x] | Frequency [f] | fx |
| 91-95 | 93 | 0 | 0 |
| 86-90 | 88 | 1 | 88 |
| 81-85 | 83 | 6 | 498 |
| 76-80 | 78 | 10 | 780 |
| 71-75 | 73 | 15 | 1095 |
| 66-70 | 68 | 34 | 2312 |
| 61-65 | 63 | 22 | 1386 |
| 56-60 | 58 | 10 | 580 |
| 51-55 | 53 | 2 | 106 |
| N=100 | ∑fx=6845 |
edu.uptymez.com
Mean  =
= 
 =
=
The mean is 68.45
MEAN BY ASSUMED MEAN METHOD
 =A +
=A + 
Where,
A = assumed mean
D = difference between the class marks and the assumed mean d= x-A
F= frequency
N= total frequency
From the above example use the data to find the mean by assumed mean method.Take the assumed mean as 58.
| Class interval | Class mark[x] | F | D=x-A | fd |
| 91-95 | 93 | 0 | 35 | 0 |
| 86-90 | 88 | 1 | 30 | 30 |
| 81-85 | 83 | 6 | 25 | 150 |
| 76-80 | 78 | 10 | 20 | 200 |
| 71-75 | 73 | 15 | 15 | 225 |
| 66-70 | 68 | 34 | 10 | 340 |
| 61-65 | 63 | 22 | 5 | 110 |
| 56-60 | 58 | 10 | 0 | 0 |
| 51-55 | 53 | 2 | -5 | -10 |
| Total |
100 | 1045 |
edu.uptymez.com
Total
A=58
 = A +
= A + 
 = 58 +
 = 68.45
The mass of students were recorded as shown below in the following figure.
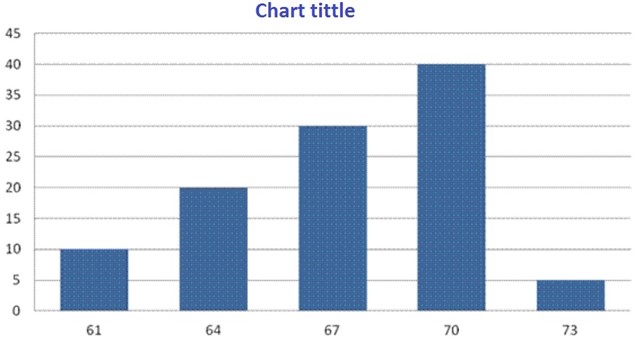
| Class mark[x] | f | fx |
| 61 | 10 | 610 |
| 64 | 20 | 1280 |
| 67 | 30 | 2010 |
| 70 | 15 | 1050 |
| 73 | 5 | 365 |
| Total |
80 | 5315 |
edu.uptymez.com
 =
= 
 =
= 

= 66.4365
 = 66.44
Exercise
a)1. Show the nglish-swahili/distribution” target=”_blank”>distribution of the children’s age in a month. Calculate the mean age in months using assumed mean that is the formula;
 = A +
= A +
Calculate the mean age in months using the formula;

= A + 
| Class mark | frequency |
| 41-46 | 3 |
| 35-40 | 4 |
| 29-34 | 9 |
| 23-28 | 12 |
| 17-22 | 18 |
| 11-16 | 28 |
| 5-10 | 26 |
edu.uptymez.com
Solution:
To calculate the mean age in months using an assumed mean that is the formula

= A +
| Class mark[x] | Frequency [f] | D= x-A | fd |
| 41-46 | 3 | 30 | 90 |
| 35-40 | 4 | 24 | 96 |
| 29-34 | 9 | 18 | 162 |
| 23-28 | 12 | 12 | 144 |
| 17-22 | 18 | 6 | 108 |
| 11-16 | 28 | 0 | 0 |
| 5-10 | 26 | -6 | -156 |
| Total | 100 | 444 |
edu.uptymez.com
Total
Let A= 11-16
Let A = 13.5
 =A +
=A + 
 = 13.5 +
 =13.5+4.44
 =17.94
2. Calculate the mean age in months using the formula for mean calculation.
Solution
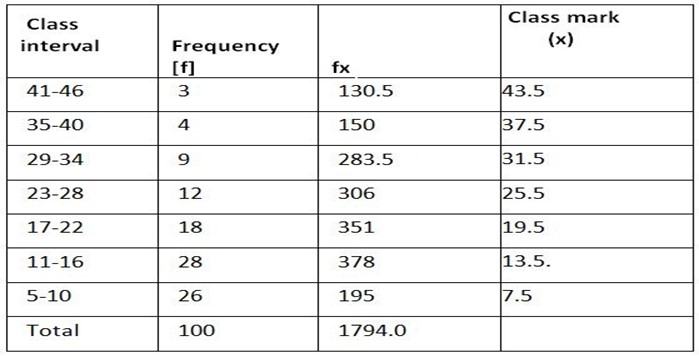
 =
= 
 =
=
 =17.94
3. A survey was of 200 children under 10 years to see how many visits they made to the clinic during the courses of the year. The results were recorded as shown in the table below.
| Number of visits | frequency |
| 5 | 16 |
| 6 | 33 |
| 1 | 47 |
| 8 | 54 |
| 9 | 31 |
| 10 | 10 |
| 11 | 4 |
| 12 | 2 |
| 13 | 0 |
| 14 | 2 |
| 15 | 1 |
edu.uptymez.com
Solution
 =
= 
| Number of visits[x] | Frequency [f] | Fx |
| 5 | 16 | 80 |
| 6 | 33 | 198 |
| 7 | 47 | 329 |
| 8 | 54 | 432 |
| 9 | 31 | 279 |
| 10 | 10 | 100 |
| 11 | 4 | 44 |
| 12 | 2 | 24 |
| 13 | 0 | 0 |
| 14 | 2 | 28 |
| 15 | 1 | 15 |
| Total | 200 | 1529 |
edu.uptymez.com
 =
=
 =
=
 =7.645
Mean number of visits per child = 7.645
4. A histogram for 100 mathematics scores use the histogram to find the mean score
Solution
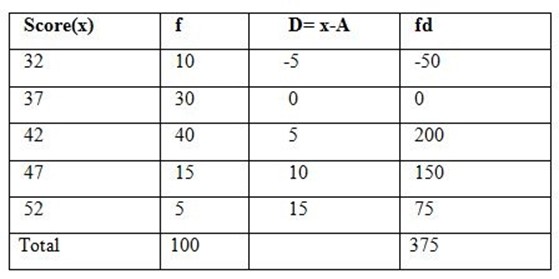
from

=A+
Let A = 37

=37+375/100

= 40.75
MEDIAN
Median is a point that divides the data into two parts such that equal numbers of the data fall above and below that point.
Computation of the median depends on whether the data is ODD or EVEN or there is duplication of data [i.e. data with frequency]
MEDIAN OF ODD NUMBERS OF DATA
STEP 1
Arrange the numbers in ascending/descending order
1,1, 2,2,5, 5
STEP 2
Pick the number which is between those numbers. If it is even find the average of the two middle numbers
e.g:-
2+2= 4/2=2
Median of numbers 2,3,9,11, 2, 2,2, 2, 3, 9, 11
STEP 1
Arrange the numbers in ascending order
2,2,2,2,2,3,3,9,9,11,11
STEP
Pick the number which is between those numbers
Median =3
Example1.
1.Find the median of the following observations
1, 7, 4, 3, 8
Solution
1, 3, 4, 7, 8
Median =4
Exercise
1) 1, 2, 5, 3. Find the median of the given data
solution
Step 1
Arrange the data in ascending order
1, 2, 3, 5
Step 2
1, 2, 3, 5
= 
= 
Median is 2.5
2) 1, 1, 3, 2, find the median given even numbers of data
Step1
Arrange the data in ascending order
1, 1, 2, 3
Step 2
1, 1, 2, 3
= 
=1.5
Median is 1.5
3) 5, 3, 1, 6, 8 find the median given odd number of data
Step 1
Arrange the data in ascending order
1, 3, 5, 6, 8,
Step 2
1, 3, 5, 6, 8
Median is 5
4) Obtain the media of the following
1, 1, 6, 9, 8, 5
Step 1
Arrange the data in ascending order
1, 1, 5, 6, 8, 9
Step 2
1, 1, 5, 6, 8, 9
5+6
Median is 5.5
5) Obtain the media of the following 2, 3, 9, 7, 1.
Step 1
Arrange the data in ascending order
1, 2, 3, 7, 9
Step 2
1, 2, 3, 7, 9
Median is 3
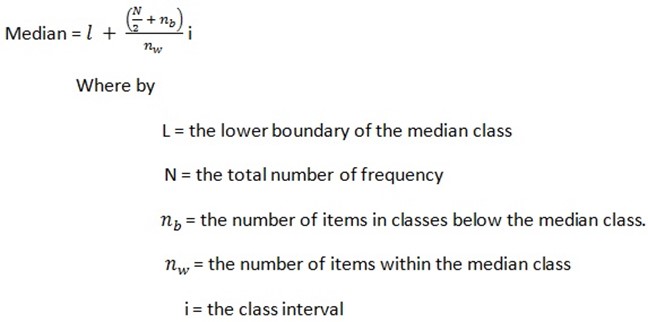
MEDIAN FOR GROUPED DATA
Example
1. The following table shows the nglish-swahili/distribution” target=”_blank”>distribution of nails in [mm]. Calculate the median length.
| Length [mm] | f | Cumulative frequency |
| 88-96 | 3 | 3 |
| 97-105 | 5 | 8 |
| 106-114 | 9 | 17 |
| 115-123 | 12 | 29 |
| 124-132 | 5 | 34 |
| 133-141 | 4 | 38 |
| 142-150 | 2 | 40 |
| Total | 40 | 169 |
edu.uptymez.com
L=?
Median class=115-123
Median position=  =
= =
= =20.5
=20.5
L= lower limit – 0.5
From 115-123
L=114.5
N = 40
nb=17
nw =12
i= 9
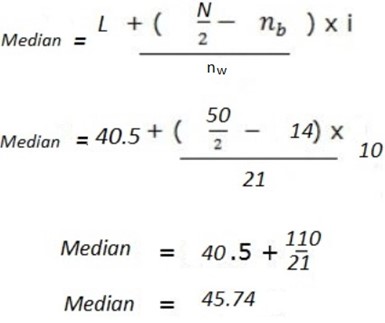
Exercise
1. The following is the nglish-swahili/distribution” target=”_blank”>distribution of marks obtained in a test given to 50 candidates
| Marks | frequency | Cumulative frequency |
| 11-20 | 1 | 1 |
| 21-30 | 3 | 4 |
| 31-40 | 10 | 14 |
| 41-50 | 21 | 35 |
| 51-60 | 6 | 41 |
| 61-70 | 5 | 46 |
| 71-80 | 4 | 50 |
| 50 |
edu.uptymez.com
Find the median mark?
Solution
L=?
Median class= ?
Median position= 
Median position = =
=  = 25.5
Median position =25.5
Median class= 41-50
L = lower limit- 0.5
From 41-50
L= 41-0.5
L= 40.5
N=50
nb=14
nw=21
i = 10
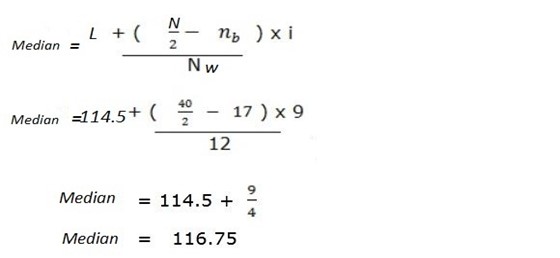
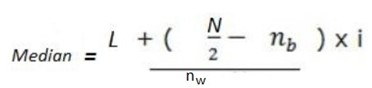
From the formula:
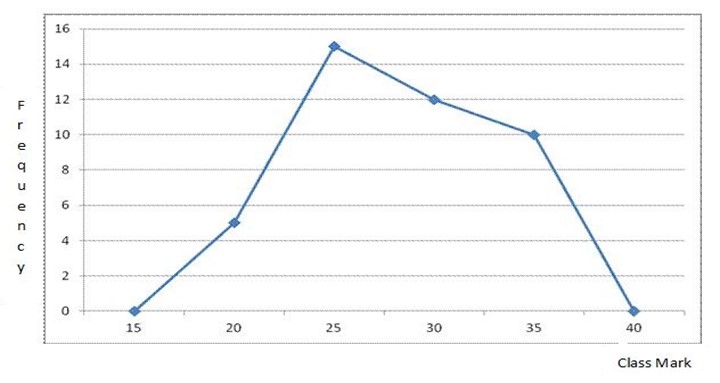
The following figure represents the graph of frequency polygon of a certain data . To find the median nglish-swahili/distribution” target=”_blank”>distribution
Solution
a)
L =?
M.p = =
=  =27
=27
L =114.5
N= 53
nb=18
nw=15
i= 9
 =114.5+ (
 )x 9
)x 9
 =114.5+[8.5/15]9
 = 114.5+5.1
 = 119.6
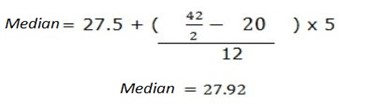
b)
Solution
L =?
M.P =N+1 = 42+1= 21.5
2 2
L = 25+30 = 55/2= 27.5
L =27.5
N=42
nb= 20
nw=12
i =5
Exercise
1. The height in centimeters of 100 people was recorded as shown below.
| Height [cm] | 160 | 165 | 170 | 175 | 180 | 185 |
| frequency | 2 | 12 | 32 | 24 | 21 | 8 |
edu.uptymez.com
Find the median height?
Solution
| Height in [cm] | frequency | Cumulative frequency |
| 160 | 3 | 3 |
| 165 | 12 | 15 |
| 170 | 32 | 47 |
| 175 | 24 | 71 |
| 180 | 21 | 92 |
| 185 | 8 | 100 |
| total | 100 |
edu.uptymez.com
L =?
Median position =  =
= 
= 50.5
L= ?
L= 170 + 175 = 345/2= 172.5
L= 172.5
N =100
nb=47
nw=24
i= 5
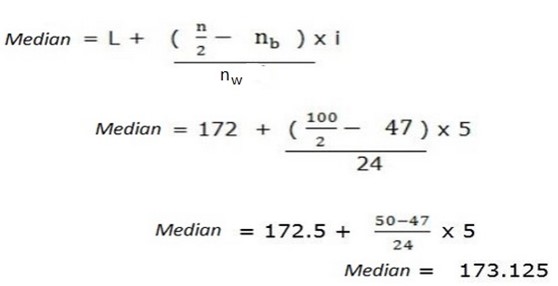
Figure 5.13 is a histogram representing test marks of 50 candidates find the median mark.
Solution
L =?
Median Point =  =
= 
=  = 25.5
| Class mark | frequency | Cumulative frequency |
| 15.5 | 1 | 1 |
| 25.5 | 3 | 4 |
| 35.5 | 10 | 14 |
| 45.5 | 21 | 35 |
| 55.5 | 6 | 41 |
| 65.5 | 5 | 46 |
| 75.5 | 4 | 50 |
| Total | 50 |
edu.uptymez.com
L = ?
L = 40.5
N =50
nb =14
nw=21
i=10
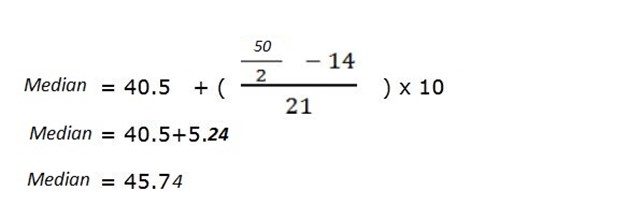
Figure 5.14 shows the frequency histogram for daily wages in TSHS of 70 people find the wages
Solution
| Wages in [TSHS} | frequency | Cumulative frequency |
| 55 | 8 | 8 |
| 65 | 10 | 18 |
| 75 | 16 | 34 |
| 85 | 15 | 49 |
| 95 | 10 | 59 |
| 105 | 5 | 64 |
| Total | 64 | |
edu.uptymez.com
Median position
 =
=  =
= 
= 32.5
L= 75+85 = 160/2
L= 80
N= 64
nb = 34
nw= 15
i=10
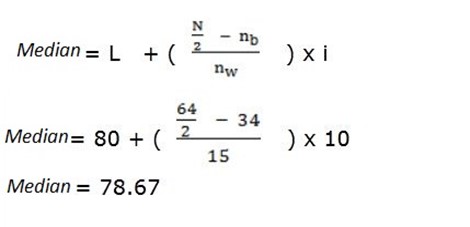
Figure 5.15 is a frequency Polygon for masses in kilogram’s of 80 students find the median mass.
Solution
| Mass in kg | frequency | Cumulative frequency |
| 47 | 0 | |
| 47 | 0 | 0 |
| 52 | 16 | 16 |
| 51 | 20 | 36 |
| 62 | 14 | 50 |
| 61 | 12 | 62 |
| 72 | 8 | 70 |
| 77 | 6 | 76 |
| 82 | 4 | 80 |
| 87 | 0 | 80 |
| Total | 80 | |
edu.uptymez.com
L =?
Median position =  =
= 
=  = 40.5
L = 62+ 61 =123/2
L = 61.5
N =80
nb=36
nw=14
i = 5
Median = 61.5 + (  ) x 5 \
Median = 62.93.
MODE
Mode is the value of data which occurs most frequently [data with the highest frequency].
Data may have only one mode, more than one mode or no mode at all.
Example
Find the mode from the following data
i) 3, 5, 7, 3, 2, 10, 8, 2, 7, 2
Mode is =2
ii) 2, 1, 2, 5, 3, 1, 1, 4, 2, 7.
Mode is=1 and 2
MODE FOR GROUPED DATA
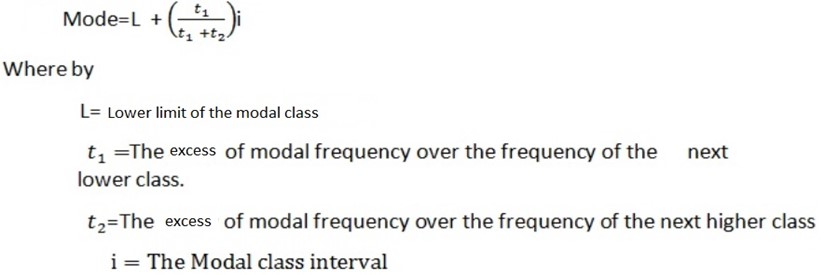
Figure 5.19 shows a histogram for heights of little children in centimeters calculate the mode of these heights
Solution
| Height in cm | frequency |
| 82 | 10 |
| 85 | 11 |
| 88 | 14 |
| 91 | 10 |
| 94 | 9 |
| 97 | 6 |
| Total | 60 |
edu.uptymez.com
Modal class =88
L =  = 86.5
L= 86.5
t1= 14-11 = 3
t2= 14-10 = 4
i= 3
M = L + 
M = 86.5 + 
M = 87.79
The mode is 87.79