ENERGY TRANSFER
The concept of food chain, tropic level and food web.
Energy containing organic molecules produced by autotrophic organisms is the source of food (materials and energy) for heterotrophic organisms.
Green plants, algae and some few bacteria (blue – green bacteria) are photosynthetic. Green plants mainly convert sunlight energy into chemical energy (food) which is used by animals some animals feed on plants in turn these animals are fed on by other animals. In this way the energy is transferred through a series of organisms.
FOOD CHAIN
Refers to the series of organisms each feeding on the proceeding organism and providing raw materials and energy for the next organism.
Each food chain starts with producers
- Producers – are the autotrophic organisms or the organisms which in turn are eaten by other organisms.
edu.uptymez.com
On the basis of food relations the biotic components of the ecosystem can be put into the following categories.
- Producers: These are autotrophs which synthesis the food using sunlight energy.
edu.uptymez.com
They include green plants, algae, protoctists and phototrophic bacteria.
Major producers of the aquatic ecosystem are algae, often minute unicellular algae that make up the phytoplankton on the surface layer of the oceans and lakes.
On land the producers are large plants, namely angiosperms and conifers which form the forest grass lands.
- Consumers
edu.uptymez.com
These are heterotrophs that obtain energy from producers directly or indirectly.
They can be put in various categories.
- Primary consumers
edu.uptymez.com
These are consumers that feed on producers.
They are referred to as herbivores on land; typical herbivores include insects as well as reptiles, birds and mammals.
In aquatic ecosystem (fresh water and marine) the herbivores are typically small crustaceans and molluscs. Most of these organisms such as water fleas, cope pods, crab larvae, barnacles and bivalves are filters feeders.
- Secondary consumers.
edu.uptymez.com
These are consumers that feed on herbivores
They are carnivores i.e. feed on flesh
Examples of secondary include carnivores such as wolf, snake.
- Tertiary consumers
edu.uptymez.com
These organisms feed on secondary consumers (the carnivores)
Example are carnivores like lion, tiger, hawk e.t.c
NB:
Secondary and tertiary consumers may be
Predators which hunt capture and kill their prey
Carrion feeder which feed on corpses
Parasites – in which case they are smaller than their host.
DECOMPOSERS AND DETRIVORES
Decomposers – Are microorganisms mainly fungi and bacteria which live as saprophytes and feed on dead organic matters. They secrete digestive enzymes on to dead materials and absorb the product of digestion.
Detrivores – These are organisms that feed on small fragments of decayed or dead materials termed detritus.
Many small animals feed on these, contributing it to the process of breakdown, because of combined activities of the true decomposers. (Fungi and bacteria) and detrivores (animals), they lead to the breakdown or decomposition of material.
Examples of detrivores are the earth worm
Decomposers and detrivores form their own food chain.
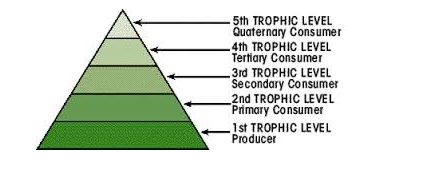
TROPHIC LEVEL
Refers to the stages of food chain
Each group of organism in a food chain form the tropic level (trophos – feeding).
The energy flows one way through various trophic levels.
There are usually four or five trophic levels and seldom more than six. Why?
- Energy decreases as one move from one trophic level to another. There is less energy to support the organisms.
- The first Trophic level is occupied by producers (autotrophs).
- The second trophic level is occupied by the herbivores
- The third trophic level is occupied by secondary consumers – the carnivores.
- The fourth trophic level is occupied by the carnivores (Tertiary consumers)
edu.uptymez.com
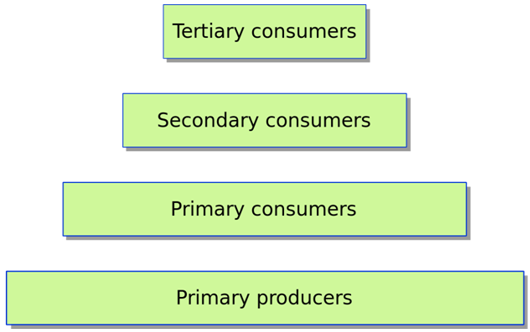
ECOLOGICAL PYRAMIDS
Feeding relationship and energy transfer through the biotic component of ecosystem may be quantified and show diagrammatically as ecological pyramids. These shows the induced changes within a single system. Ecologists use these pyramids in gathering data for quantitative comparison of all major world ecosystem.
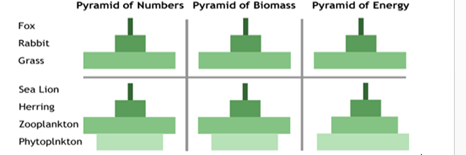
Pyramids of Numbers
In ecosystems the smaller organisms usually outnumber the large organisms. Pyramid of numbers shows the number of organisms in each trophic lever and how they change in successive levels of ecosystem.
.In a trophic lever based pyramid of numbers the organisms of a given area are first counted and then grouped in their trophic levers.
.There is a progressive decrease in the number of animals at each successive level
.Plants in the first trophic level often outnumber animals at the second trophic level but it will depend on the relative size of organism
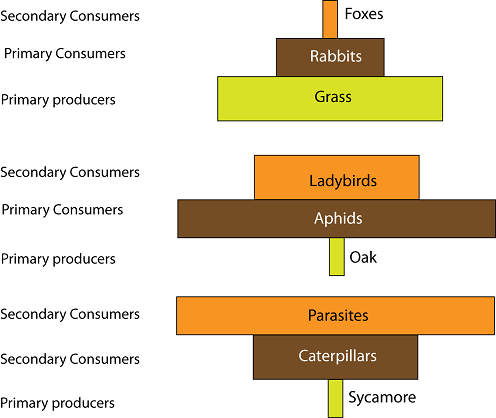
Types of Pyramid of numbers.
Pyramid of Biomass
This take consideration of the total mass of the organisms (biomass) estimated at each trophic level. Ideally the dry mass is compared.
The estimation of dry mass is done by weighing representative individuals (sampling).
The rectangle is drawn in proportation of the mass at a particular trophic level. The biomass at the time of sampling is considered.
This is known as the standing mass or standing crop mass.
Drawback of Pyramid of Biomass
- It is more laborious and expensive in terms of time and equipment.
- It does not allow for changes in biomass at different time of the year e.g. deciduous tree have a large biomass in summer than in winter, when they have shed their leaves.
- The rate at which the biomass accumulates is not taken into account. A mature tree has a large biomass which increases slowly over many years.
edu.uptymez.com
Inverted pyramids of biomass are obtained only for aquatic ecosystem. This frequently happens in food chains which start with phytoplankton. These organisms are very small and have a much more rapid town over than their 200 plankton predators.
The pyramid of biomass can be bulged at the middle.
-
They do not show the rate production (productivity that is the amounts of materials and energy passing from one trophic level to the next).
In a given period of time, period such as one year for example a fertile, intensively grazed pasture may have a small standing crop of grass but higher productivity.
Pyramid of Energy
These are type of ecological pyramid drawn based on the amount of energy at each trophic level.
This shows how much energy passes from one trophic level to the next the length of the producers bar is proportional to the amount of solar energy annually in photosynthesis.
The length of other basis shows the rate at which energy passes along the food chain.
The pyramids of energy take into account the rate of production in contrast to pyramids of numbers and biomass which depict the standing states of organisms at a particular moment in time. The energy at each trophic level is estimated by establishing of the energy value for that trophic level.
NB: The transfer of energy from producers to primary consumers is less efficient than between the other trophic level.
The average efficiency of transfer from plants to herbivores is about 10% and from animals to animals is 20%.
Like other type of ecological pyramids, the energy decreases as you move from lower to higher trophic levels.
The following are the possible causes of this:
- Some energy is used for metabolic activities at each trophic level, mainly respiration.
- A lot of energy is lost in form of heat hence is not available in the ecosystem energy lost in respiration cannot be transferred to other living organisms.
- Some energy is locked in animal or plant parts which cannot be eaten e.g. Bones, horns, nails, and feathers of animals and cellulose materials of plants which are indigestible.
- Organisms do not assimilate some of the materials taken in as food.
- The consumer population is unable to harvest enough of the food population.
edu.uptymez.com
The diagram below represents a pyramid of energy for an aquatic ecosystem.
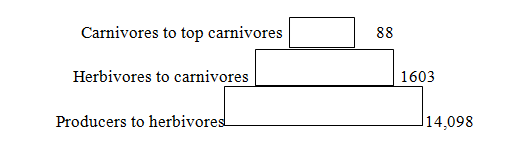
Carnivores to top carnivores 88
Herbivores to carnivores 1603
Producers to herbivores 14,098
pyramid of energy for silver springs, Florida (energy flow in KJ m-2 yr-1)
NB:
Each bar of a pyramid of energy represents the amount of energy per unit area or volume that flow through that trophic level in given time period.
Usefulness of Pyramid of Energy.
- It takes into account the rate of production, in contrast to pyramids of numbers and biomass which depict the standing states of organisms at a particular moment in time.
- It allow different ecosystem to be compared including the relative importance of population within one ecosystem.
- They tell how much energy is required to support each trophic level because only a proportion of energy in a level is transferred to the next.
- Energy pyramid are never invested nor do they have a central bulge
- Energy pyramids are more informative than the pyramid of number and biomass.
-
Disadvantages of Ecological Pyramid of energy.
- They are the most difficult to obtain data
-
They are not an accurate method of representing energy content of the ecosystem.
General criticisms of Ecological pyramids
- The pyramids of numbers, biomass and energy depend on assigning living organisms to trophic level. While the correct level is obvious for plants and obligate herbivores. Many carnivores and omnivores eat a varied diet and thus their trophic level varies according to the food selected.
-
It is hard to fit dead material (detritus) and other waste together with their consumers into conventional pyramids. These materials are important as a food source.
BIOCHEMICAL CYCLES – The cycling of Matters
The chemicals found in living organisms are derived originally from the abiotic components of the ecosystem such as soil, water and air to which they eventually return by way of the decomposition of waste products or dead bodies of organisms. Bacteria and fungi bring about decomposition; obtain energy from the waste products and dead organisms in the process.
Biochemical cycling is the constant cycling of chemical materials needed by living organisms within the ecosystem.
The process is called biochemical cycle since both living and non-living parts of the ecosystem is involved.
Distinction between chemical cycling and energy flow.
Chemicals in the ecosystem are constantly recycled and used again, on the other land; energy transferred within the ecosystem is changed into forms which cannot be used again by the system, mainly heat energy. Because some of the energy is lost we cannot talk of recycling rather than the flow of energy through the ecosystems.
To maintain the ecosystem, frequent and regular inputs of solar energy is needed.
Cycles can be recognized for all chemical elements that occur in living systems. The biogeochemical cycles for carbon (C), Nitrogen (N), Sulphur (S) and Phosphorus (P) are very important. These elements from the major macronutrients in Biochemical cycles for Nitrogen and carbon.
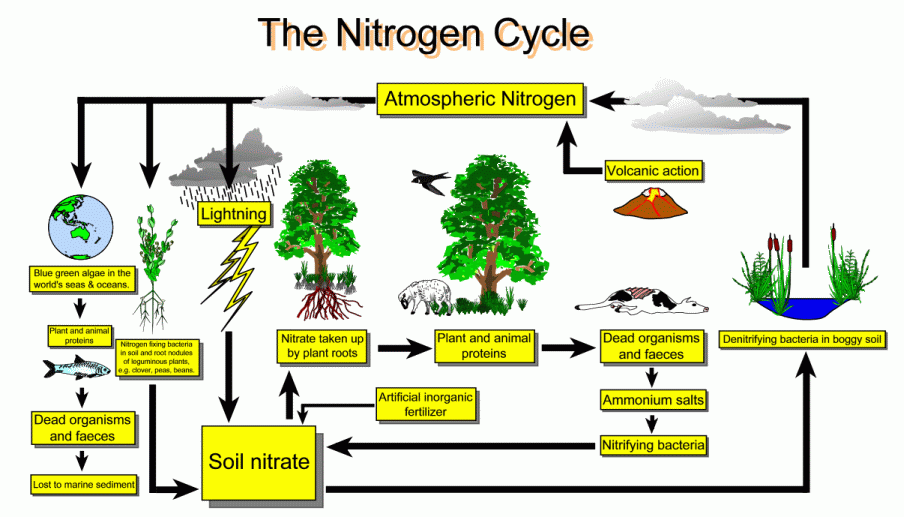
NITROGEN CYCLES
Nitrogen is an abundant element in the atmosphere. Nitrogen makes up about 78% of the atmosphere by volume, yet very few organisms can use this gaseous nitrogen directly instead they depend upon soil minerals, especially nitrates as their source of nitrogen plants cannot incorporate nitrogen into organic compounds and therefore depend on various types of bacteria to make nitrogen available to them.
Nitrogen deficiency commonly limits plant growth. This is the main reasons that nitrogen is commonly applied in the form of artificial fertilizers.
The nitrogen cycle can be summarized as follow.
- Nitrogen Fixation
edu.uptymez.com
This refers to the conversion of the free nitrogen (N2) in the atmosphere into nitrates, ammonia or other ammonium compounds. This is accomplished in several way
i.Biological fixation – This occurs when nitrogen (N2) is reduced and added to organic compound by action of Nitrogen – fixing bacteria such as Azobacter and clostridium, the cyano bacteria in aquatic system and some free living bacteria in the soil are able to reduce nitrogen gas to ammonia (NH3).
Other nitrogen – Fixing bacteria e.g.: Rhizobium infects and lives in modules on the roots of leguminous plants. They make reduced nitrogen and organic compounds available to the host plants.
ii.Electrochemical and photochemical fixation
In this process nitrogen gas is converted to nitrate (NO3) in the atmosphere by lightening and other cosmic radiations on oxygen and Nitrogen lightening and other cosmic radiation provide high energy needed for nitrogen to react with oxygen.
iii.Industrial fixation – Fixed by chemical fertilizer industries to the nitrogen cycle when they convert nitrogen gas to nitrate for use as fertilizers.
- Nitrification
- Nitrification is the production of nitrates. Nitrogen is converted to Nitrate (NO3–) in several ways.
- By lightening and other cosmic radiation
- By the action of nitrifying bacteria ammonia (NH3) in the soil is converted to Nitrates by certain soil bacteria in a two – step process flost, nitrite producing bacteria convert ammonia to nitrite (NO2–) this is achieved by free living bacteria such as Nitrosomonas.
edu.uptymez.com
2NH3 + 3O2+ 2NO2– + 2H+ + 2H2O
Ammonia oxygen nitrite hydrogen ion water
The second step involve the oxidation of the Nitrite by other free living bacteria e.g. Nitrobacteria and nitro coccus
2NO2–+ O2 2NO3–
- Humans make a most significant contribution to the nitrogen cycle when they convert nitrogen gas to nitrate for use in fertilizer.
- Nitrogen used by plants and animals.
edu.uptymez.com
Plants take the nitrates from the soil and form proteins. When animals eat plants the proteins are converted into animal proteins. The breakdown of protein is excreted in the form of urea or uric acid or ammonium compounds. In the soil or water, decomposition of the waste takes place and nitrogen is converted back to free nitrogen involving number of steps.
- Decomposition by Microorganisms
edu.uptymez.com
Like Actinomycetes and fungi and by ammonofying bacteria. These convert wastes and decayed and dead boodles to ammonia or ammonium compounds.
-
Denitrifying bacteria
Denitrification is the conversion of nitrate to nitrogen gas. These are denitrifying bacteria in both aquatic and terrestrial ecosystem. Examples are the Pseudomonas and Thiobacillus, Detoxification counter balance nitrogen fixation but not completely. More nitrogen fixation occurs especially due to fertilizer production.
edu.uptymez.com