FUNCTIONS:
Is the corresponding between two objects. E.g older than. Smaller than ect.
Relation can be thought as:
(i) Rule
(ii) A mapping
Example

(iii) A graph of x-y plane.
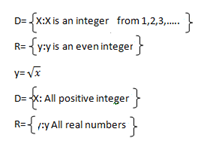
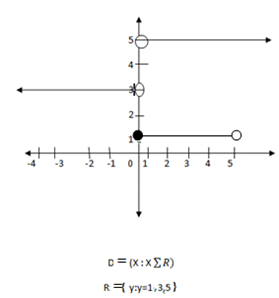
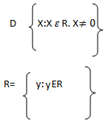
DOMAIN
-Is the set of all possible value of x in which the corresponding value of y is known
Example
Given y= 
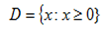
RANGE
Is the set of all possible value of y in which the corresponding value of x is known
Example
Y=2x
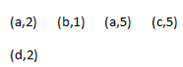
ii. Relation as a mapping
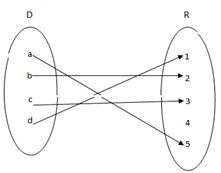
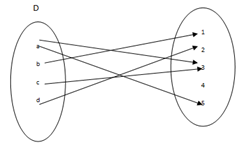
In x- y plane (ordered pair)
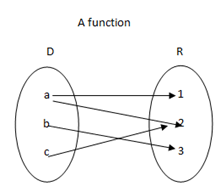
FUNCTION:
Is the mapping a single element from domain into range?
Not function
TYPES OF FUNCTION
The following are some types of function
1. CONSTANT FUNCTION
f(X)=c
2. LINEAR FUNCTION
f(x)=ax+b
3. QUADRATIC FUNCTION.
f(x) = ax2 +bx+c
4. ABSOLUTE VALUE FUNCTION
f(x)=1×1
5. RATION FUNCTION

1: CONSTANT FUNCTION
SKETCHING THE FUNCTION:
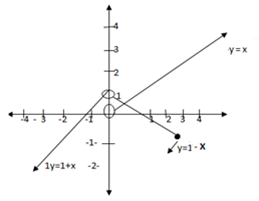
Suppose. Given the function
If f(x)=y
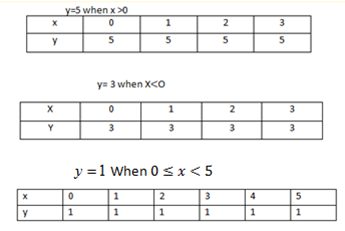
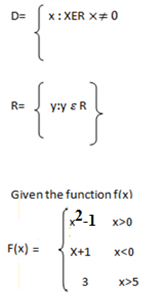
Given the function
Suppose
y=x for which x for which x>0
Solution:
Suppose that
f(x)=y
y=x2-1 x>0
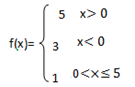
Step function
Sometimes referred as compound function, are linear function whose variables have a special relationship under certain conditions that make their graphs break in intervals(Look like steps).To understand the concept, let us look at the following example.
The cost of shaving the hair of different age-groups in a central salon are as follows
a) Shaving the group against ten to twenty years costs Tsh 2000/=
b) The group aging between twenty and thirty exclusive costs Tsh 4000/=
c) The group aging thirty and above costs Tsh 6000/=
From the above information provide domain and range
Solution
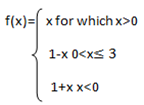
If we let x the ages and f(x) be the costs, then we can interpret this problem as a step function defined by
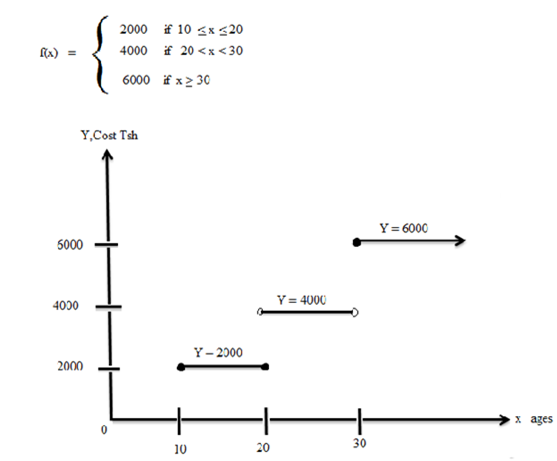
The domain of this function is a set of real numbers such that x ≥ 10.
The range of this function is {200,400,600}.
Graph of Quadratic function.
A quadratic function is a polynomial of the second degree.
It is a function of the general form ax2 + bx + c
Where a, b and c are real numbers and a ≠ 0
Example
Draw the graph of the function
(i) f(x) = x2-1
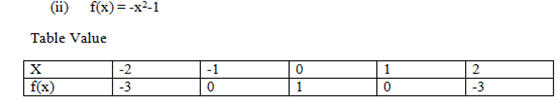
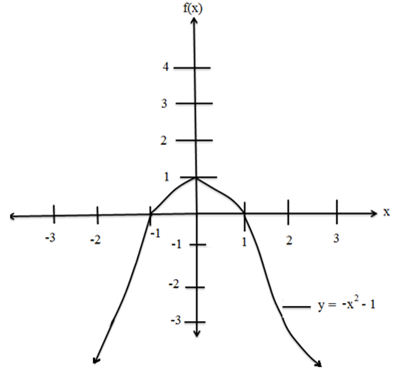
(ii) f(x) = -x2-1
Solution
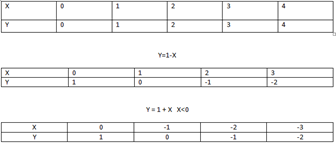
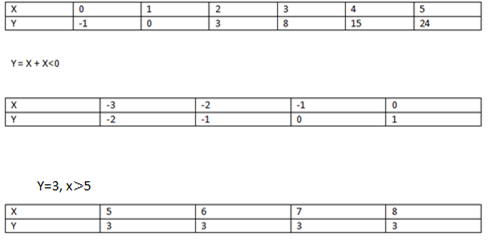
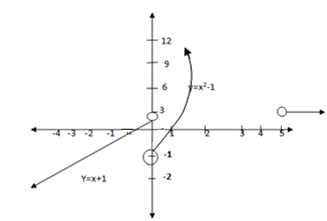
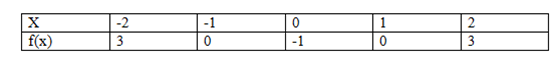
Table Value
(i) f(x) = x2-1
Its graph
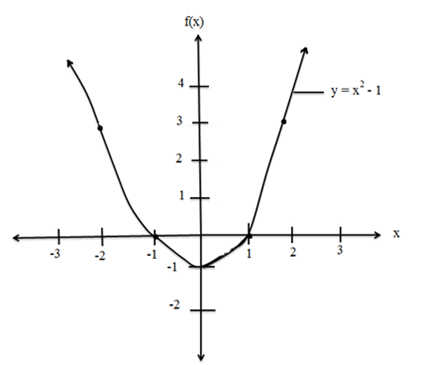
Its graph
Drawing graph of cubic function
-When the polynomial function is reduced to the third degree a cubic function is obtained.
The cubic function is take a general form f(x) = ax3 + bx2 + cx + d
Where a, b, c and d are real numbers and a ≠ 0
Example
Draw the graph of the following function
f(x) = x3 – 9x
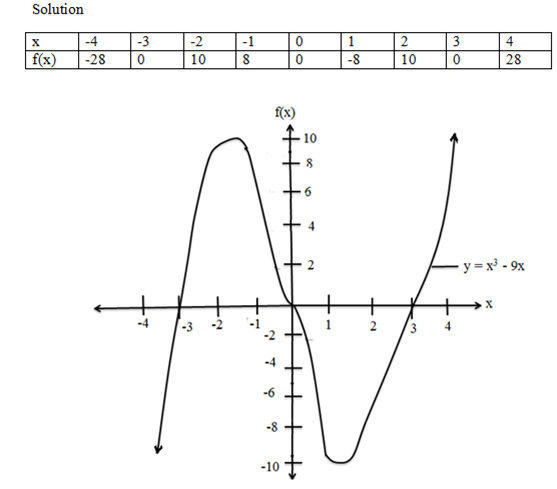
-The intercept are points (-3,0),(0,0),(3,0)
-There are two turning points; the maximum i.e (-2,10) and the minimum i.e (2,-10)
-The domain is the set of all numbers
-The range is the set of all real number’s y.
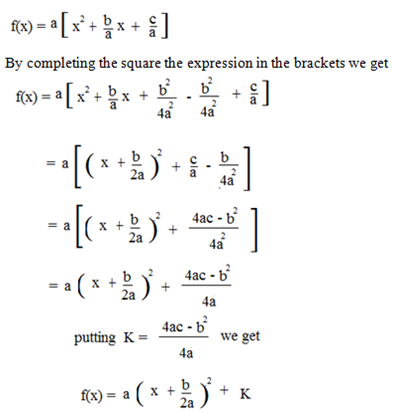
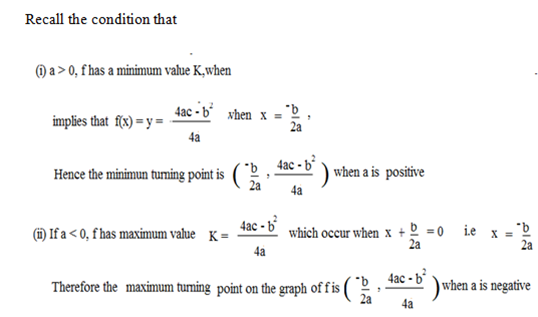
For the turning point let us consider the function f(x) = ax2 + bx + c .b. The function f may be expressed in the form of g a[g(x)] + k
Where g(x) is another function in x and k is a constant as follows.
f(x) = ax2 + bx + c
Factorizing out the constant a
Example
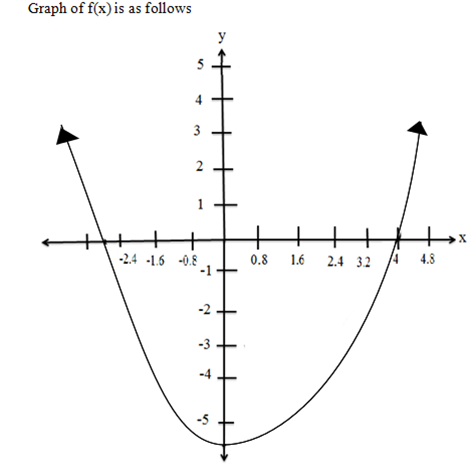
Sketch the graph of f(x) = x2 + 2x+ 8, determine the turning point and the intercepts
Solution
x2 + 2x+ 8= 0
Solving we get
(x + 2)(x – 4) = 0
x + 2 = 0 x – 4 = 0
x = 2 , x = -4 which are intercepts
-The y-intercept C is -8
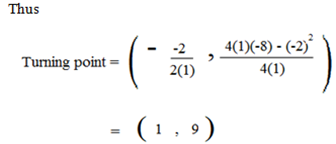
-To obtain the turning points, equate x2 + 2x+ 8= 0 to ax2 + bx + c = 0, so that the comparison we get
a = 1, b = -2, c = -8
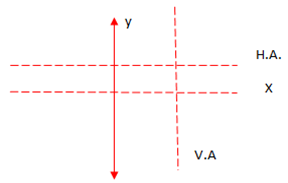
ASSYMPTOTES
There are lines in which the curve does not touch there are two types for g Assymptotes.
- Vertical assymptotes.
- Horizontal assymptotes
edu.uptymez.com