GRAPHS OF FUNCTIONS
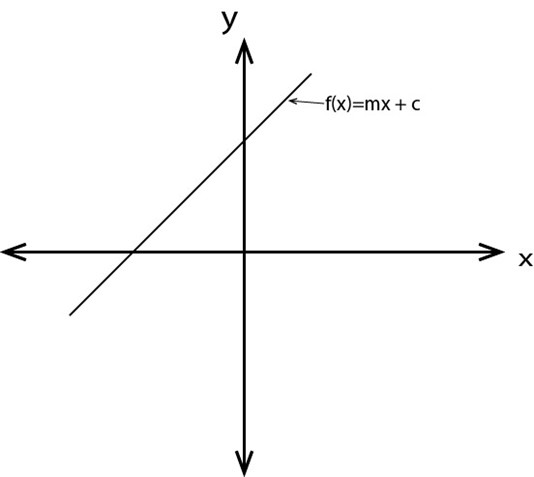
A) Linear function
If the function of the form f (x) = mx +c
M = slope
C = constant
Examples
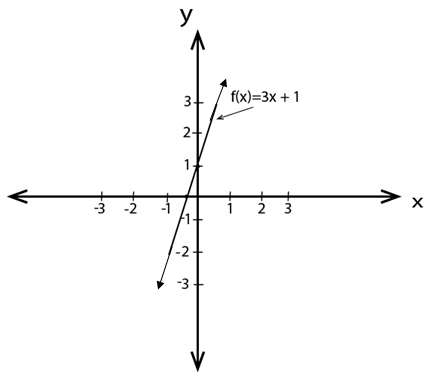
1.) Draw graphs of the following and give their domain and range
f (x) = 3x +1
Solution
f (x) = 3x+1
Intercept
When x = 0, y = 1
y = 0, x = 
 Domain =
Range = 
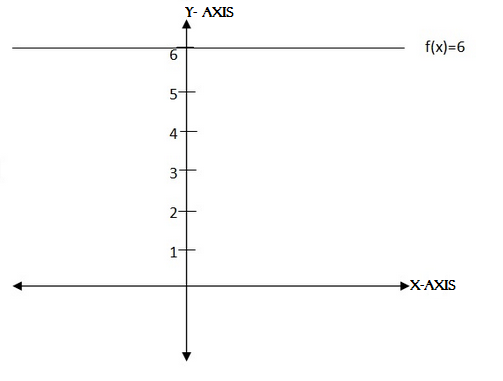
2) f(x) = 6
Domain = 
Range = 
Note
f(x) = a is called the constant function
Exercise
1) Given that f(x)=x2 and g(x)=x
Find the domain and range of
a) f (x) + g(x)
b) f (x) – g (x)
c.) f (x) g (x)
d) f (x) – g(x)
2) Draw graphs of
a.) f(x)= -3x+1
b.) f(x) = 3x-1
d.) f( x ) = ½ – x
Solution
1a) f(x) +g(x)
y = x2 + x
TURNING POINTS OF A QUADRATIC FUNCTION
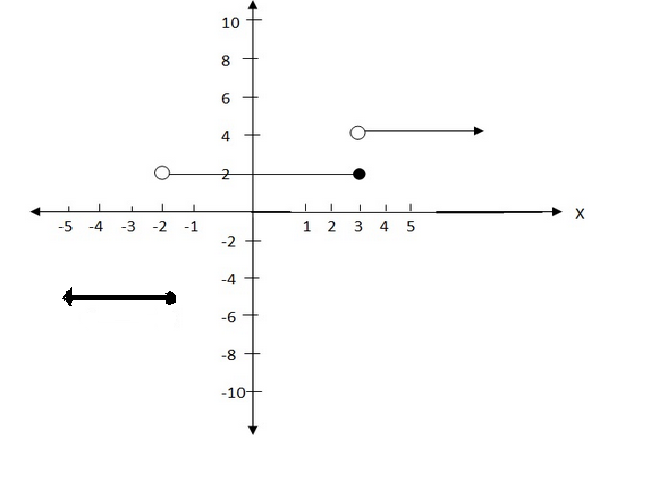
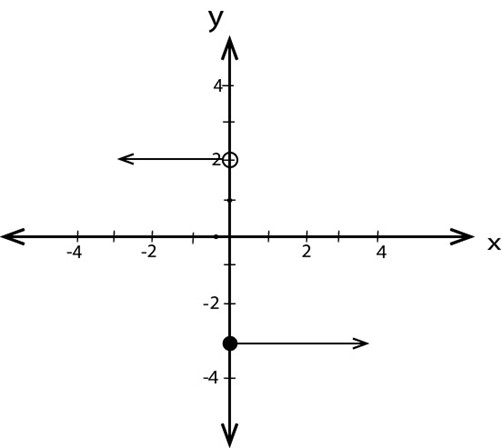
Step function
Are functions which are not continuous.
Example
Draw the graphs of the following function give its
Domain and range
f(x) = 
Solutions
Domain = 
Range = 
C) QUADRATIC FUNCTIONS
Is the function of the form
Where a 
Example
Draw the graph of
Solution
Exercise
1. Draw the graphs of the following functions give the domain ad the range
i) f (x)= 
ii) f(x)= 
ii) f(x) = 
2. Draw graphs of the following functions
a) i) 
b) ii) 
c) iii) f(x)= x2-x
d) iv) g(x)= -4x2-1
Solutions
f (x ) = 
Domain = 
Range = 
TURNING POINTS OF QUADRATIC FUNCTION
Given the function
f(x)=ax2+bx+c where a, b and c are constants
By completing the square

y = 
= 
= 
y = 

(Case :1)
If a  then a( x +
  )2≥0
)2≥0
Therefore

 The function is minimum
When y =  and
and 
(Case 2)
If a  then a [x +
 ] 2
] 2

 y =
y = 
 The function maximum when
  and
and 
Note
The maximum and the minimum points are the turning points of quadratic function
Examples (1)
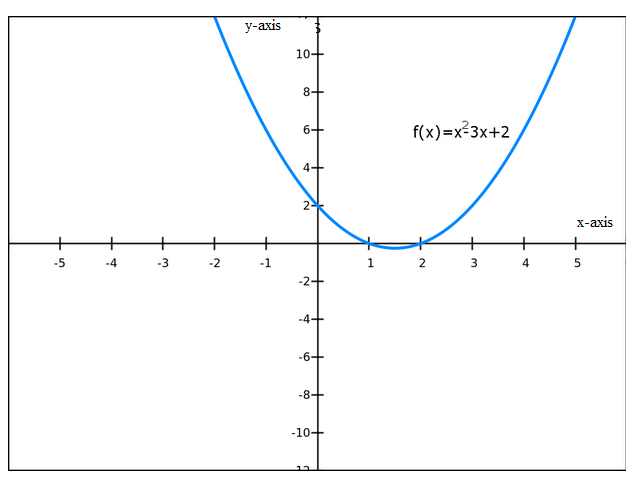
Find the turning points of the function
 → y = x2 – 3x + 2
Therefore x = 3/2 , y = – ¼
Therefore turning point = ( , -1/4)
Alternatively:
x = -b/2a , y = 
a = 1, b = -3, c = 2
Therefore x = 3/2
y = -1/4
Example 2
Find the turning point of the function


x = 2, y = -1
Turning point = (2, -1)
Example 3
Find the domain and range of the function
p(x)=-x2+4x-5
Solution
Domain = 
Range = 

 =
= 
Range

Exercise
1) Find the turning points of the following
a.) f (x) = x2 -4x + 2
b.) f (x) = x2 + 8x + 5
c.) f (x) = 5 -6x – 9 x2
d.) f (x) = 3x2 + 8x – 1
e.) f (x) = x2 -4x – 5
2) Find the domain and range
a.) f (x) = x2 – 4x + 2
b.) f (x)= 3x2 +8x – 1
c.) f (x) = -5 – 6 – 9x2
d.) f (x) = 2 –x – x2
e.) f (x) = x2 – 4x +2
Solution
a) 


Turning point= ∴ x = 2, y = -2
Turning point=(2,2)
b) 
Solution


x = – 4
And
y = – 11
Therefore Turning point = (-4, -11)
c) f ( x) = 5- 6x- 9x2
Since


y = -4 , x = 1/3
Turning point = (  , – 4)
d) f (x) = 3x2 +8x – 1
Solution


x = -4/3 , y = -17
Turning point =(-4/3, -17)
Alternatively
x = -b / 2a
x = -8/2 [ 3]
x = -8/6
x = -4/3
x = -4/3

= 

y = -19/3
Turning point = 
e) f (x) = x2 – 4x -5
Solution


x= 2, y = -9
Turning point =(2,-9)
Alternatively
x = -b/2a
x = -[ -4 ][ 1]
x = 4/2
x = 2

= 
= 
= 
= -9
 Turning point = (2,-9)
2 a) 
Domain = 
Range = 
y ≥ -8/4
y ≥ -2
Range = 
∴ Domain = 
Range = 
b) f (x) = 3x2 + 8x – 1
Solution:
Domain = 
Range = 
y ≥ 19/3
Range ={  }
}
Domain = 
Range = 
C) f (x) = 5 – 6x – 9x2
Solution
y = -9x2 – 6x + 5
Domain = { x : x ┇IR}
Range = { y : y ≤  }
}
y 
 Domain =
Range = 
Using intercepts and turning points to sketch the graph of quadratic functions
Example
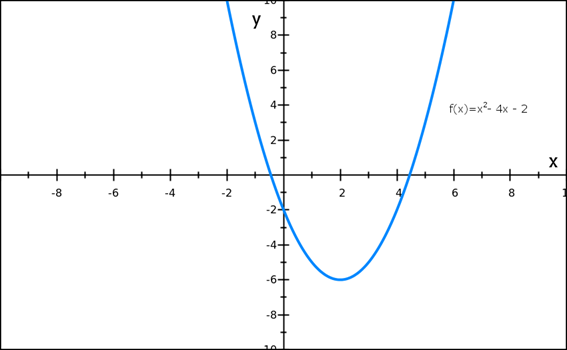
Sketch the graph of

Solution
y – Intercept
When
x = 0, y = -2
x- Intercept
When
y= 0, x2– 4x – 2 = o
x = 
x = 
x = 
x = 
x = 
x =  or
or 
x= 4.5 OR x = -0.5
Turning point
x = 
x = 
x = 2

= 
= – 6
Turning points = (2,-6.)
Since a  the function has a minimum value therefore the graph opens upwards
Exercise
Sketch the graphs of the following functions using intercepts and turning points

Solution

y intercept
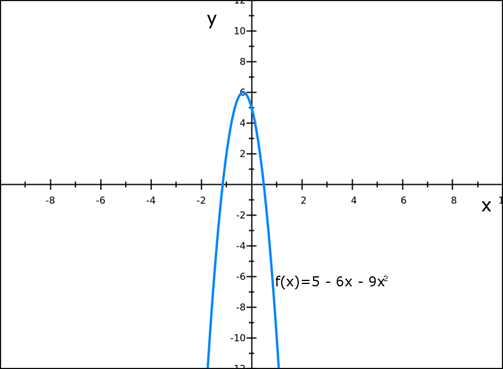
When x = 0, y = -5
x intercept
When y = 0, -9x2 -6x +5 = 0
x = 
x = 
x = 


Either x
=  or
or 
x = 20.7/-8 or -8.7/-18
x = -1.2 or x = 0.5
Turning points
x= -b/2a
x = – [-6/2 [-9]
x =- 1/3 or – 0.3
y = 
y = 
y = 
y = 
y= 6
Turning points = (-0.3 , 6)
Since a  the function has a maximum value therefore the graph opens down wards
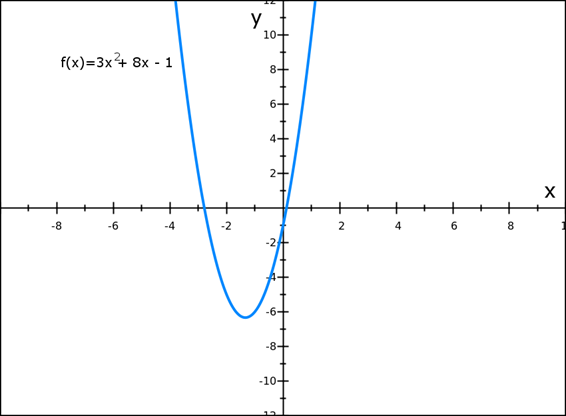
2) f(x) = 3x2 + 8x -1
Solution
y – Intercept
When x=0, y = -1
x – Intercept
When y = 0, 3x2 +8x-1=0
x = 
x = 
x = 
x = 
Either
x =  or
or 
x = 0.12 or -2.8
Turning points
x= -b/ 2a
x = -8/ 2 [3]
x = -8/6
x = -4/3 or -1.3
y = 
y = 
y = 
y = 
y = -6
Turning points = (-1.3,-6)
Since a  the function has a minimum value therefore the graph opens upwards
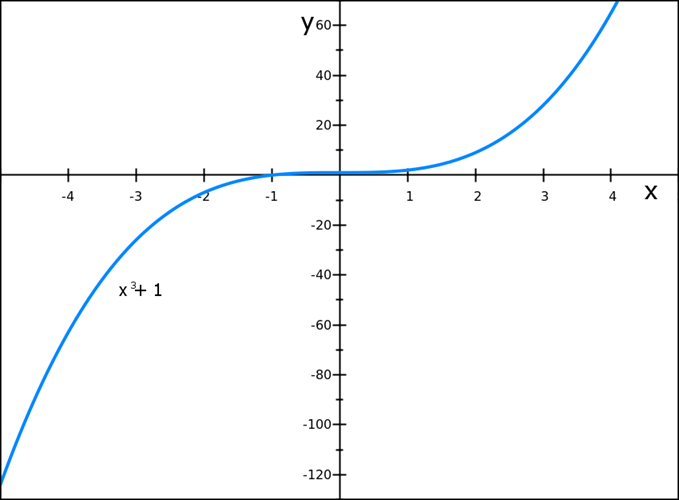
D) Cubic function
Is a function of a form f (x) = ax3 + bx2 – (x + d) where a, b, c and d are real numbers
a
Example
Draw the graphs of f (x) = x3 +1
Solution