This topic uses the knowledge of graphical solution of system of linear equations and inequalities. Owing to that, we will start this topic by looking at this important background knowledge.
SOLUTION OF SYSTEM OF LINEAR EQUATIONS
A system of linear equations can be solved graphically, by graphing the two linear equations on the same Cartesian coordinate plane, and solution of this is given by the point of intersection.
Example 11.1
Solve the system of equations by graphing 
SOLUTION
We must obtain a table of values for the two linear equations. In all these, we will use only two points. This is because two points determine a straight line.
Table 11.1 3x – y = 4
Table 11.2 2x + y = 6
Figure11.1 shows the graph of the information’s in table 11.1 and 11.2
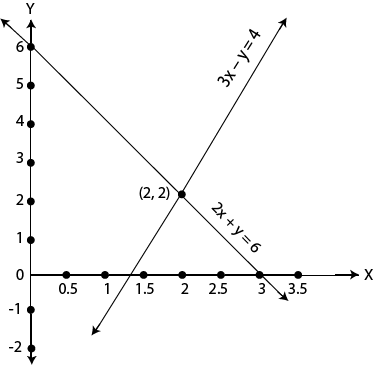
The two lines intersect at (2, 2)
Thus, the solution of the system is (2, 2) i.e x = 2 and y = 2
A system of linear equations that has unique solution like  is said to be
Consistent and independent
There are equations that the same gradient (inclination) and the same x and y intercept. These system of equation have all of their points coinciding, as such we say they have infinitely many solutions.
Example 11.2
Solve the system of equations below graphically 
Solution
The x and y intercepts of the equations above are 1 and 3 respectively is shown in figure 11.2.
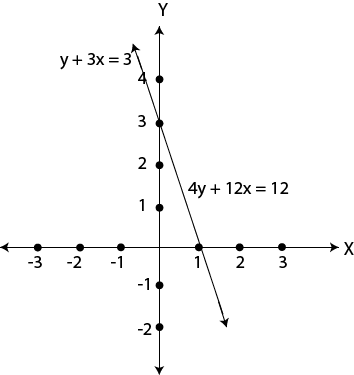
Hence, the solution set is (
Note that, any system of linear equations which has infinitely many solution is said to be INCONSISTENT and DEPENDENT.
Example 11.3
Solve the following system of equations graphically: 
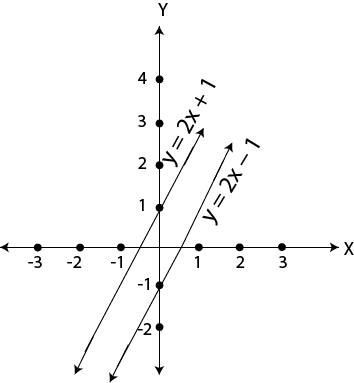
Shows two straight lines that are not intersecting however much they are neither side. We call them parallel lines. I or the reason these two lines are not the system does not have a solution. Any system of linear equations that doesn’t have a solution is said to be INCONSISTENT.
Table 11.3 summarizing the study on graphical solutions of linear equation
|
Graph |
Inclination (gradient) |
Name of the system |
|
Lines that intersect |
Distinct inclinations and distinct intercepts. |
Consistent and independent. |
|
Parallel lines |
Same inclinations but distinct intercepts. |
Inconsistent. |
|
Lines that concide |
Same inclinations and intercept. |
Consistent and Dependent |
edu.uptymez.com
1. The following system of linear equations graphically and state whether the consistent and independent, inconsistent or consistent and dependent:
2. 
3. 
4. 
5. 
6. Write an equation the line that is inconsistent with the line 3x – y – 1 =0 and goes though (1, 1).
7. Write an equation of the line is inconsistent with the line 3x – y – 1 = 0 and
Goes through (1, 1)
8. Line kx + ty – 8 is consistent and dependent to line 12x + 15y = 24. Find the values of k and t that fit the stated condition.
Graphing systems of inequalities
Systems of inequalities can also be solved graphically. They have solutions like linear equations, but their solution are regions which satisfy set of inequalities being graphed.
1. Obtain the line of equality (boundary lines) by replacing the inequality sign with an equal sign.
2. Draw the line of equality (equalities) in Cartesian coordinate plane.
3. Test for the region satisfies the inequality (inequalities) and shade it
Example 11.4
Solve the following system graphically 
Solution
The line of equalities for the above inequalities are y = 4, y = -3 and y = x + 1
Note
If the line of equality was derived from the inequality ≥ or ≤ the line must be drawn as full line, but if it was from > or < the line must be made broken
Draw each of the above lines in the same Cartesian coordinate plane, test and shade the required region.
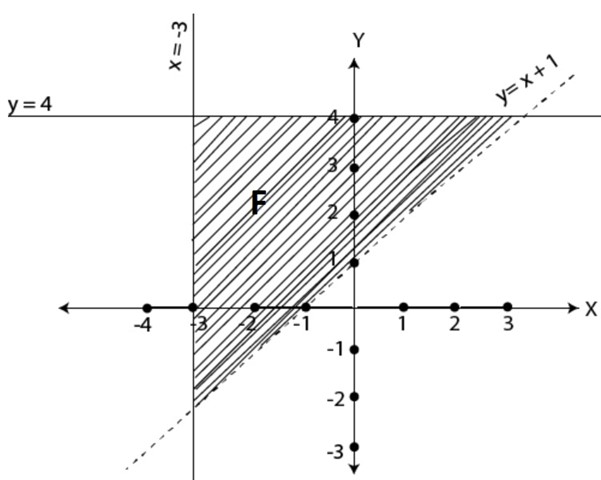
The figure shows the required graph for the set of the inequalities.
The region marked F in figure 11.4 is the solution of the set of the given inequalities. We call it feasible region. If the system of inequalities does not have a region that satisfies all the inequalities in a given set, that system does not have a solution.
Exercise 11.2
Does the point given against each system of inequalities satisfy the system?
1.  (0, 0)
2.  (1, 0)
3.  (5, 5)
4.  (0, 4)
5.  (1, 1)
Solve each of the following inequalities graphically
6. 
7. 
8. 
9. 
10. 
11. 
12. 