1. VAPOUR PRESSURE OF IDEAL SOLUTIONS OF TWO LIQUIDS
The vapour in equilibrium with a mixture of two liquids is a mixture of two vapours, and the total vapour pressure is the sum of the two partial vapour pressure. All three pressures vary with temperature and with the composition of the solution.
The change with the composition for ideal solution at a fixed temperature, is describe by Raoult’s law (1886) which state that the partial vapour pressure of A in a solution, at a given temperature, is equal to the vapour pressure of pure A, at the same temperature, multiplied by the mole fraction of A in the solution.
In an Ideal solution components A and B will have just the same tendency to pass into the vapour phase as they have in pure A and pure B because the internal forces within the pure liquids and the solution are like.
There will however be relatively fewer particles of A in a solution containing both A and B than in a pure A, so that the partial vapour pressure of A above the solution might be expected, ideally to be proportional to the mole fraction of A in the solution. Similarly the partial vapour pressure of B above the solution would be proportional to the mole fraction of B.
The total vapour pressure above the solution would be equal to the sum of the partial vapour pressures of A and B.
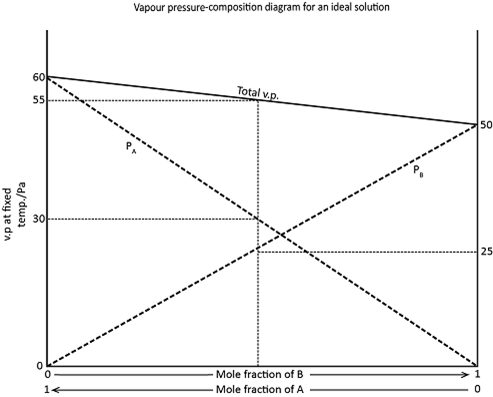
This is illustrated in the figure below. The vapour pressure of pure B is 50 but it is only 25 when the mole fraction of B in a solution with A, is 0.5.
Similarly the vapour pressure of a pure A is 60, but only 30 at a mole fraction of 0.5. The total vapour pressure of a mixture of A and B at a mole fraction of 0.5 will therefore be 25 plus 30, i.e 35, Numerical result of this type are given only by ideal solutions eg. hexane and heptane or bromoethane and idoethane.
VAPOUR PRESSURE COMPOSITION DIAGRAM FOR NON – IDEAL SOLUTION
What is non ideal solution?
Non ideal solution is the solution which do not obey some or not all assumption of Raoult’s law
Non Ideal solution are of two types:
i) Positive deviation from Raoult’s law
ii) Negative deviation from Raoult’s law
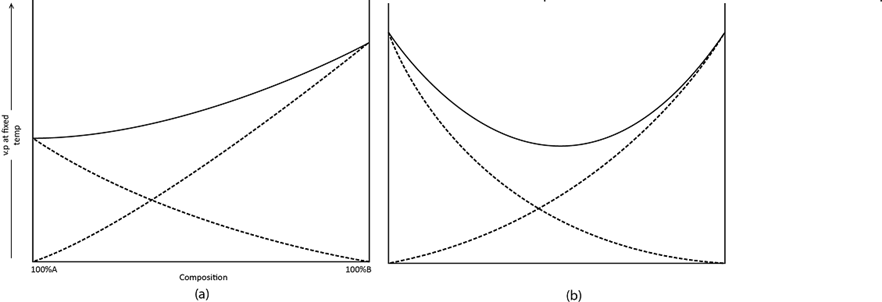
i) POSITIVE DEVIATION FROM RAOULT’S LAW
The positive deviation is observed when the saturated vapour pressure of the solution is greater than the expected one (ideal).
This is due to the large number of molecules that escape from liquid phase to vapour phase.
The large number of molecules escape is due to the fact that intramolecualar forces of attraction is greater than intermolecular forces of attraction.
Vapour pressure composition diagram/positive deviation from Raoult’s law.
ii) NEGATIVE DEVIATION FROM RAOULT’S LAW
The negative deviation is observed when the saturated vapour pressure of the solution is less than the expected one (ideal)
This is due to the less number of molecules that escape from liquid phase to vapour phase
The small number of molecule that escaped is due to the fact that intermolecular forces of attraction is less than the intramolecular forces of attraction
Vapour pressure composition diagram/negative deviation from Raoult’s law
(2) BOILING POINT COMPOSITION DIAGRAM
The shape of the boiling point diagram depends on the nature and the degree of deviation from Raoult’s law of the two liquids concerned. There are three important type of diagram:
i) No maximum or minimum
This type corresponds with the vapour pressure composition diagrams. Any deviation from Raoult’s law is relatively small.
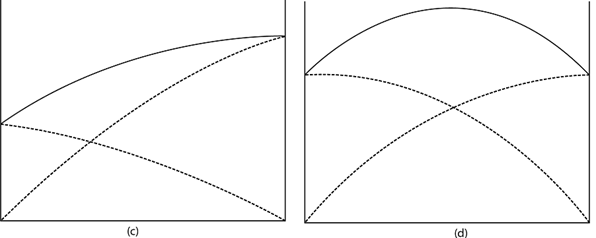
ii) A maximum boiling point
Corresponding with vapour pressure composition diagrams and a large negative deviation from Raoult’s law.
iii) A minimum boiling point
Corresponding with vapour pressure composition diagrams and a large positive deviation from Raoult’s law.
Boiling point composition diagrams with no maximum or minimum
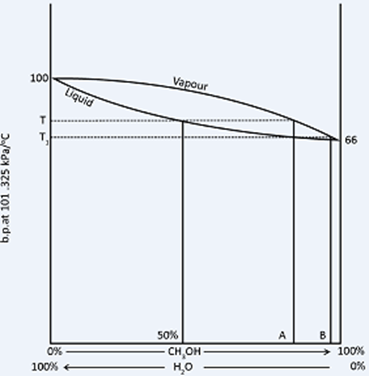
Boiling point composition diagram with no maximum or minimum
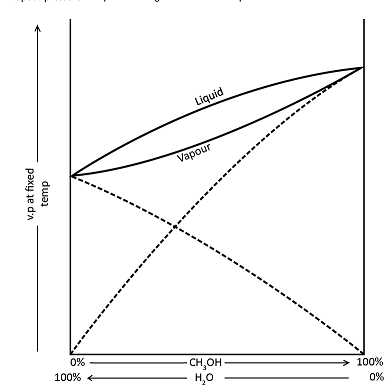
A diagram of this type is given by methanol water mixtures. The liquid line shows the way in which boiling point of methanol water mixture varies with composition at fixed pressure.
For liquid mixture of any one composition the water vapour with which it is in equilibrium will be richer in the more volatile component i.e. in methanol. The liquid line has therefore an associated vapour line. The vapour pressure composition diagram corresponding with this Boiling point composition diagrams as shown above.
When a mixture of methanol and water containing 50 per cent of each is boiled, it will boil at temperature T. The vapour coming from it will have a composition represented by A, and on condensing, this liquid is boiled again, it will now boil at temperature t1, giving a vapour of a composition B, and this will condense into a liquid whose composition is also B. By repeating this boiling condensing boiling point process, pure methanol could be obtained, but the method would be tedious, and the same result can be obtained in one operation by fractional distillation using a fractionating column.
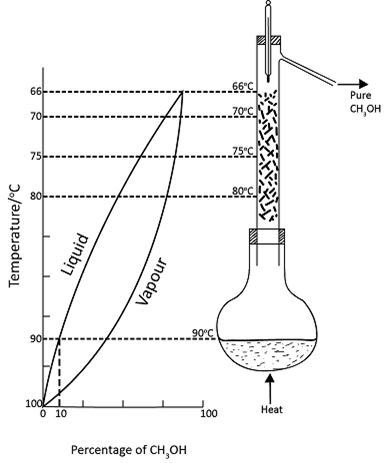
Idealized and simplified representation of the fractional distillation of a mixture of methanol 10% and water 90% using fractionating column.
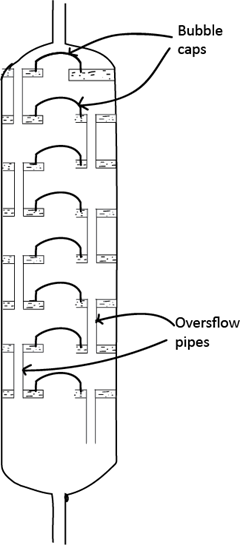
A simple and effective column for laboratory use consists of along glass tube packed with short lengths of a glassing tubing, glass beads or specially made porcelain rings. The aim is to obtain a large surface area, and there are many patent designs of column. Industrially, a fractionating tower is used. Such a tower is divided into a number of compartments by means of trays set one above the other. These trays contain central holes, covered by bubbles caps, to allow vapour to pass up the tower and overflow pipes to allow liquids to drop down.
At each point in a column or at each plate in a tower, an equilibrium between liquid and vapour is setup and this is facilitated by an upward flow of vapour and downward flow of liquid, a large surface area slow distillation. It also preferable to maintain the various levels of the column or tower at a steady temperature so that external lagging or an electrical heating jacket is often used.
A fractionating tower
These state of affairs existing in an idealized and simplified distillation of a mixture of a methanol and water, containing 10 per cent by mass of methanol as shown in the figure above. The figure shows five liquid vapour equilibria which are setup at different temperatures in the fractionating column.
The purpose of the fractionating column is to facilitate the setting up of this equilibria.
Mixtures of varied compositions can be drawn off from different points on the column or tower as is done, for instance in the fractional distillation of crude oil in a refinery.
BOILING POINT COMPOSITION DIAGRAM WITH MAXIMUM
The vapour pressure composition diagram for nitric acid water mixtures shows a minimum and the corresponding boiling point composition diagram, with a maximum is shown.
On distilling a mixture of nitric acid and water containing less than 68.2 per cent nitric acid, the distillate will consist of pure water and the mixture in the flask will become more and more concentrated until it contain 68.2 per cent nitric acid . At this stage, the liquid mixture will boil at a constant temperature because the liquid and the vapour in equilibrium with it have the same composition, i.e. 68.2 per cent nitric acid.
Mixtures containing more than 68.2 percent nitric acid will give a distillate of a pure nitric acid until the residue in the flask reaches the 68.2 percent nitric acid.
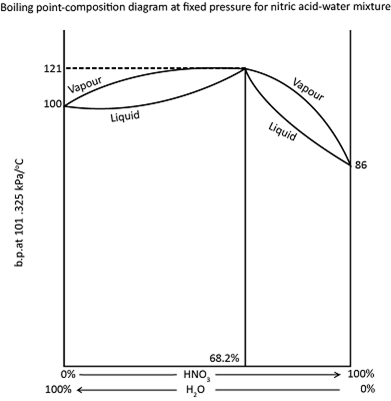
Thereafter the distillate will 68.2 percent nitric acid be as before. A mixture with this type of boiling point composition curve cannot be completely separated by the fractional distillation. It can only be separated into a one component and what is known as the constant boiling mixture, maximum boiling point mixture, or azeotropic mixture.
Maximum boiling point of mixtures are also obtain from mixtures of water with hydrofluoric, hydrobromic, hydrochloric, sulphuric and methanoic acids.