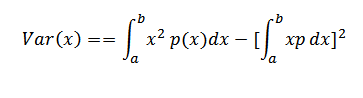
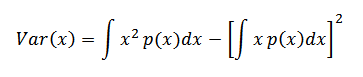
Variance
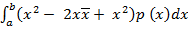
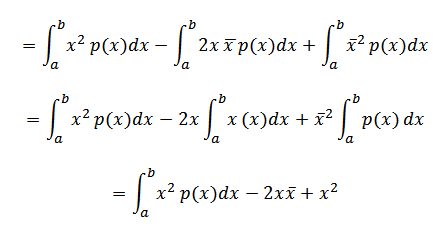
From
= 
= 
= 
= 
= 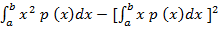
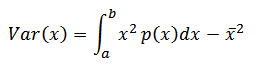
Therefore
Example
A continuous random variable x has a probability function given by
P (x) = 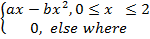
Observation in x indicates that expectation of x is 1, show that a = 1.5 and find value of b
Solution
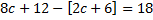
P (x) = ax – bX2, 0 ≤ x ≤ 2
Also
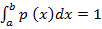
=  +
+  dx = 1
= 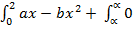 dx = 1
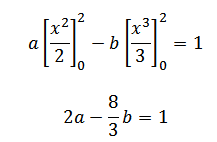
=  –
–  + 0 =1
Note

=  – =
– = 
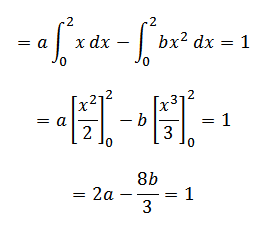
= a – b
– b  = 1
= 1
Also
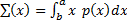
Æ© (x) = 
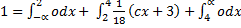
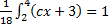
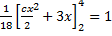
1 = 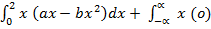 dx
dx
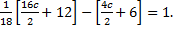
1 = 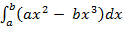
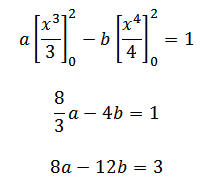
6a –8b = 3
2a – 4b = 0
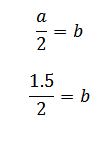
a = 2b
b = a/2
8 (a) – 12 (a/2) = 3
8a – 6a = 3
2a = 3
a = 1.5 shown
Also
b = 0.75
Example
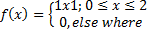
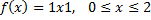
The random variable x denotes that the number of weeks of a certain type of half life of the probability density function f (x) is given by
f (x) 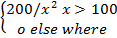
Find the expected life
soln
From
Æ© (x) = 
 =
=  +
+ 
= 
=  dx
dx
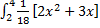
= 200  dx
dx
= 200 [ ]
] 
= 200 [ 
= 2
 = 2 weeks
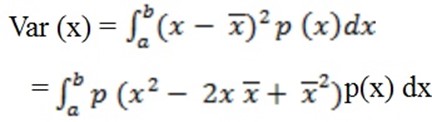
= 
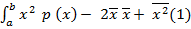
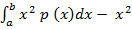
=  p (x) dx – x
=  p (x) dx – [
Therefore
Example
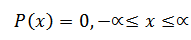
A continuous random variable x has a probability function given by
P (x) = 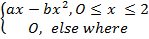
Observation in x indicates that expectation of x is 1, show that a = 1.5 and find value of b
Soln
P (x) = ax – b , O
, O  X
X 
P (x) = 0, –
 x
x 

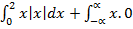
Also

=  +
+  dx = 1
=  –
–  + 0 = 1
Note
 –
– 
Also
 =
= 
Example
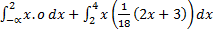
Given that the probability nglish-swahili/distribution” target=”_blank”>distribution function for random variable x is given by
Find the expected value
Solution
But

Now
=
=
=
=
= 
Expected value is 
Example
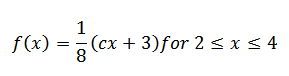
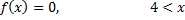
A function
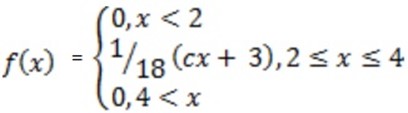
Find the value of c if it is a probability density function hence calculate
(i) Mean
(ii) Variance
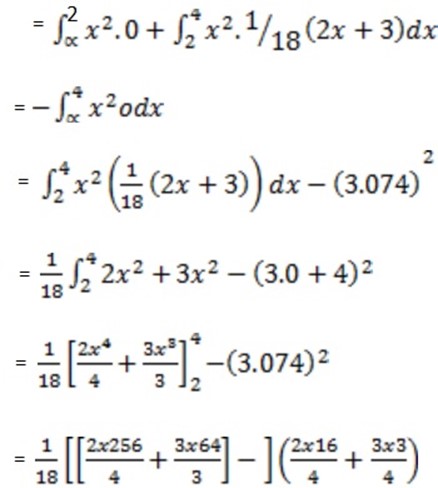
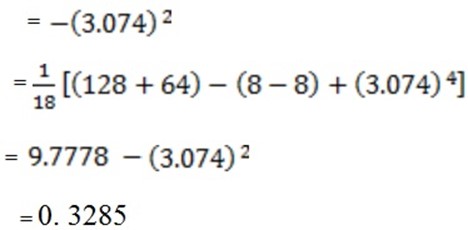
Solution


(i)Mean
= 
= 
=
= 
=
= 
= 
= 
= 
= 
= 3.074
(ii) Var(x)
From
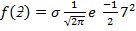
NORMAL DISTRIBUTION
Normal nglish-swahili/distribution” target=”_blank”>distribution is a continuous nglish-swahili/distribution” target=”_blank”>distribution.
It is derived as the limiting form of binomial nglish-swahili/distribution” target=”_blank”>distribution for the large values of n where p and q are not very large.
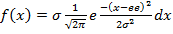


STANDARD VALUE
For standard value

Where
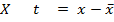
X = variable

Hence
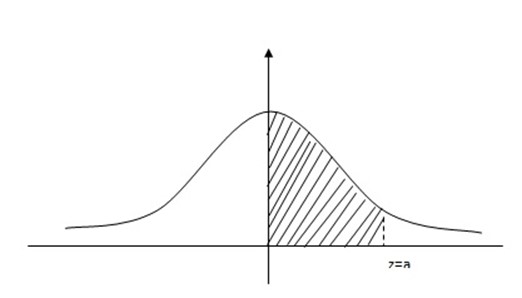
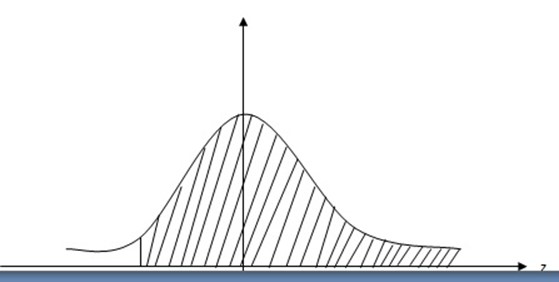
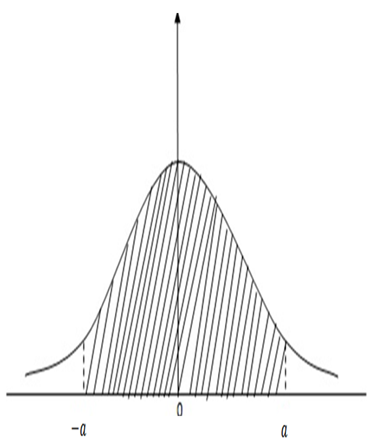
NORMAL CURVE
 A frequency diagram can take a variety of different shapes however one particular shape occurs in many circumstances
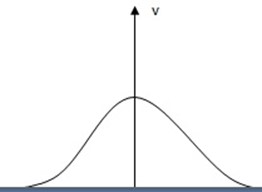
-This kind of diagram is called NORMAL CURVE
PROPERTIES OF NORMAL
DISTRIBUTION CURVE
(i) The curve is symmetrical about the mean
(ii) The value of
(iii) As 
(iv) The curve never to…….x-……………..
(v) The curve is maximum at x = ee
(vi)The area under the curve is one re area (A) = 1 square unit
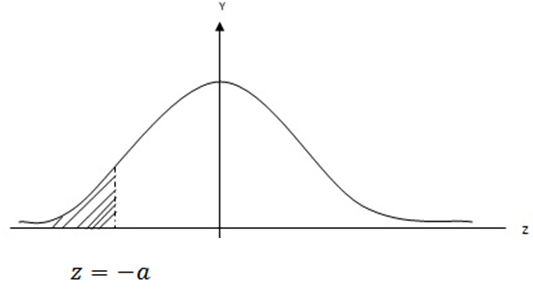
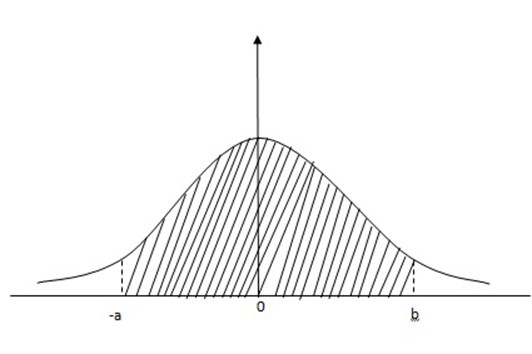
AREA UNDER NORMAL CURVE
By taking

The standard normal curve is found.
- The total area under the curve is one.
- The area under the curve is divided into two equal parts by zero.
- The left hand side area is 0.5 and the right hand side area is 0.5
edu.uptymez.com
– The area between the ordinate and any other ordinate can be noted from the TABLE or CALCULATOR
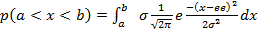
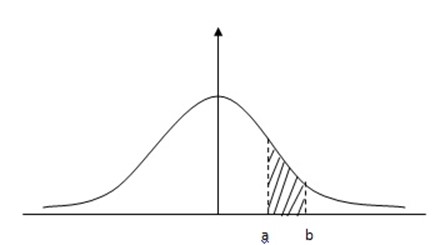
Probability from Normal nglish-swahili/distribution” target=”_blank”>distribution curve.
1. 
2. 
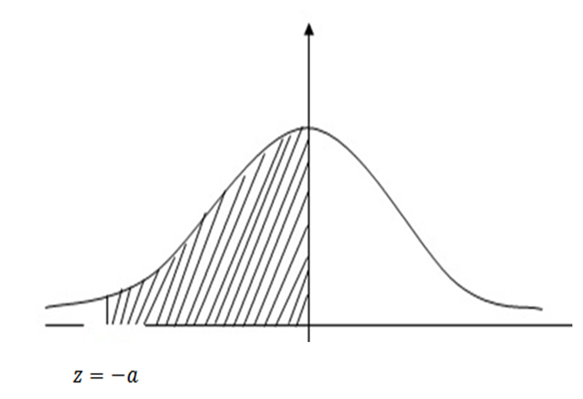
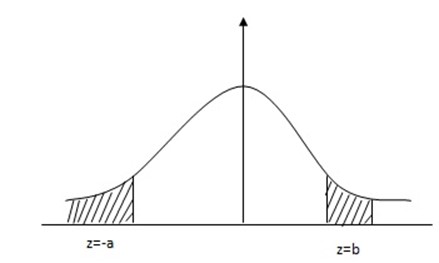
3. 
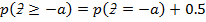
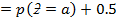
Note:  =0.5 –
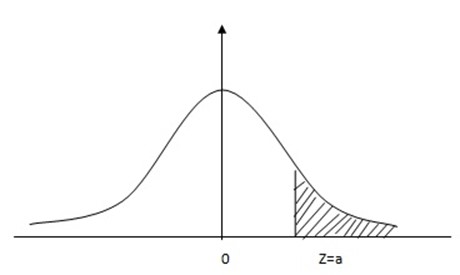
4. 
NOTE: 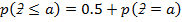
5. 
Note:
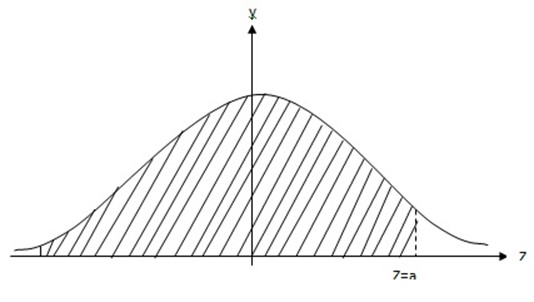
6. 
Note:
7. 
Note:
 =
=
8. 
Note:

= 
= 2.
9. 

10. 
Note:

=
STATISTICAL CALCULATION
(NORMAL DISTRIBUTION)
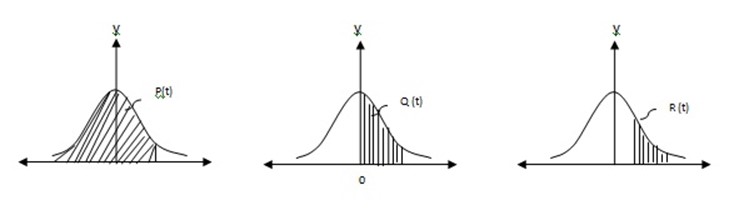
Consider the set up screen shown below;
Small between large
 PC QC RC t
1 2 3 4
Therefore
xQn
where

 (standard score)
Question
Find the area under the normal curve in each of the following cases;
(a (a) 
(b (
b)
(c (c) 
(d (
d) 
(e (e) 
(f) 
Solution (a)