C.MEASURES OF POSITION
These are;
i) Quartile
ii) Decile
iii) Percentile
1. QUARTILE
This is the division of frequency nglish-swahili/distribution” target=”_blank”>distribution into four equal parts.
Hence there are;
1st –quartile
2nd-quartile
3rd-quartile
-The position of 1st quartile is 
-The position of 2nd quartile is 
-The position of 3rd quartile is 
N.B. 2nd quartile is the median
INTER-QUARTILE RANGE
This is the different between 1st and 3rd quartile
Mathematically;
Inter-quartile =3rd quartile – 1st quartile
I.Q.R = Q3 – Q1
SEMI- INTER QUARTILE RANGE
This is given as a half of inter-quartile range
i.e. semi inter quartile range
Semi I.Q.R=
2. DECILE
This is the division of frequency nglish-swahili/distribution” target=”_blank”>distribution into ten equal parts
Hence there are
1st Decile

2nd Decile

3rd Decile

5th Decile

9th Decile
The position of 1st decile is 
The position of 2nd decile is 
The position of 3rddecile is 
The position of 5rd decile is 
The position of 9th decile is
N.B
The 5th decile is the median
PERCENTILE
This is the division of frequency nglish-swahili/distribution” target=”_blank”>distribution into 100, equal parts, hence these are;

2nd percentile
3rd percentile
4th percentile
50th percentile
99th percentile
The position of 1st percentile is 
The position of 2nd percentile is
The position of 3rd percentile is 
The position of 50th percentile is
The position of 99th percentile is
N.B. 50th Percentile is the median
Examples
Given the nglish-swahili/distribution” target=”_blank”>distribution 2, 3, 4, 5, 6, 7, 8, 9 find
i) 1st quartile
ii) 2nd quartile
iii) 3rd quartile
iv) Inter- quartile range
v) Semi inter-quartile range
Solution
Given 2, 3, 4, 5, 6, 7, 8, 9
n=8
i) 1st quartile (Q1)
Position of (Q1) =
= 2nd Value
1st quartile = 
ii) second quartile (Q2)
Position of Q2 = 
=  4th value
2nd quartile =
iii)Third quartile (Q3)
Position of Q3 = 

3rd quartile = 
iv) Inter-quartile range
I.Q.R = Q3-Q1
7.5 3.5 = 4
v) Semi inter-quartile range
S.I.QR 
QUESTIONS
3. Given the nglish-swahili/distribution” target=”_blank”>distribution 1, 2, 3, 4, 5, 6, 7, 8, 9 find
i) Quartile 1
ii) Quartile 2
iii). Quartile 3
4. Given the nglish-swahili/distribution” target=”_blank”>distribution 2, 3, 5, 6, 7, 8, 9, 9, 10, 11, 12 find.
a) Lower quartile
b) Median
c) Upper quartile
5. From the nglish-swahili/distribution” target=”_blank”>distribution 20, 23, 23, 26, 27, 28 find
i) Q1 ii)Q2 iii)Q3
6. Given the nglish-swahili/distribution” target=”_blank”>distribution 147,150,154,158,159,162,164,165 find i) Q1 ii) Q2 iii) Q3
7. Given the frequency nglish-swahili/distribution” target=”_blank”>distribution 10,12,13,15,17,19,24,26,26, find i)Q1 ii) Q2 iii) Q3
8. From the frequency nglish-swahili/distribution” target=”_blank”>distribution 2,3,4,5,6,7,8,9,10,11,12
Find i) first decile
ii) 4th decile
iii) 5th decile
9. The following table below shows the scores obtained when a dice thrown 60 times .Find the median score
| SCORE | 1 | 2 | 3 | 4 | 5 | 6 |
| FREQUENCY(F) | 12 | 9 | 8 | 13 | 9 | 9 |
edu.uptymez.com
10. Find the median and inter quartile range of the frequency nglish-swahili/distribution” target=”_blank”>distribution
| X | 5 | 6 | 7 | 8 | 9 | 10 |
| F | 6 | 11 | 15 | 18 | 16 | 5 |
edu.uptymez.com
GROUPED DATA
This is the grouping of frequency nglish-swahili/distribution” target=”_blank”>distribution obtained from various experiments.0-9, 10-19, 20-29, 30,-39
TERMINOLOGIES
1 .LOWER CLASS INTERVAL
This is the lower interval or lower limit of the class.
Example
x1 →x2, x5→ x6, x7 →x8
x1, x5, x7 are lower interval of the classes
2. UPPER CLASS INTERVAL
This is the upper interval of upper limit of the class.
E.g. x1 →x2, x3→ x4, x5 →x6
x2 ,x 4 and x6 are the upper interval of the classes
3. CLASS MARK(X)
Is the average between class intervals.
Mathematically;
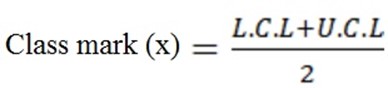
Where L.C.L=lower class limit
U.C.L= upper class limit
4. CLASS BOUNDARIES
These are real limits of the classes
a) Upper class boundaries
i.e. 
Where;
U.C.B = upper class boundary
U.C.L = Upper class limit
b) Lower class boundary
L.C.B = L.C.L-0.5
Where;
L.C.B Lower class boundary
L.C.L = Lower class limit
5. CLASS SIZE(WIDTH)
Is the difference between lower or upper and upper class limit or class boundaries between two successive classes.
Mathematically;


REPRESENTATION OF GROUPED DATA
These are;
i) Frequency nglish-swahili/distribution” target=”_blank”>distribution table
ii) cumulative frequency nglish-swahili/distribution” target=”_blank”>distribution table
iii) frequency histogram
iv)Cumulative frequency curve (o give)
v) frequency polygon
vi) scatter diagram
1. FREQUENCY DISTRIBUTION TABLE
Is the table of class interval with their corresponding frequency.
| class interval | 0-9 | 10-19 | 20-29 | 30-39 |
| frequency | 2 | 7 | 3 | 4 |
edu.uptymez.com
How to prepare frequency nglish-swahili/distribution” target=”_blank”>distribution table
A. IF CERTAIN CLASS INTERVAL PROVIDED
In this case, prepare the frequency table by using interval provided
Complete the column of frequency by random inspection.
→The last interval should end up to where the highest value belong to
B. IF CERTAIN CLASS MARKS PROVIDED
1st method
i) Mark the lowest value from the data provided and call it as lower limit (L) of the first class interval
ii)using the formula of class mark calculate the upper limit(u)
Class mark
iii) Indicate the first interval as L to U
The proceed under the same interval in order to get frequency nglish-swahili/distribution” target=”_blank”>distribution table
2nd method
i) Get class size (c) then find the value of (
ii) By using the value of ( get the intervals as follows
Lower interval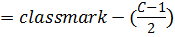
Upper interval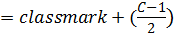
iii) By using class interval obtained prepare the frequency nglish-swahili/distribution” target=”_blank”>distribution table
C. IF CLASS MARK AND CLASS INTERVALS ARE NOT PROVIDED
In this case the frequency nglish-swahili/distribution” target=”_blank”>distribution table should be prepared under the following steps.
i) Perform random inspection of highest and lowest value
ii) Determine the value of the range as follows
Range (R) =
R
iii) Determine the class size according to required number of classes by using the formula

Where r=range
C=class size
N=number of class required
E.g. C=
C=
iv) By using class size obtained above, prepare frequency nglish-swahili/distribution” target=”_blank”>distribution table by regarding condition existing from the data
Examples
1.The following are the results from mathematical test of 20 students 27,21,24,27,31,40,45,46,50,48,38,29,49,98,35,34,44,23,25,49 prepare the following nglish-swahili/distribution” target=”_blank”>distribution table by using class interval 21-25,26-30,31-35
2. The following are the results of physics test of 50 students at Azania sec school 21,23,48,54,64,77,68,52,31,40,33,43,53,61,71.82,75,61,64,34,25,26,31,32,36,48,45,44,55,52,60,67,67,7,74,78,80,85,90,97,26,27,37,38,34,39,40.41.45.48 prepare the frequency nglish-swahili/distribution” target=”_blank”>distribution table using class mark 23,28,33
3. 3 .The data below give time in minutes .it takes a computer to drive to work for a period of lasting 50 days
25,40,27,43,23,28,39,33,29,26,34,32,28,30,39,32,25,27,28,28,27,35,28,46,24,24,22,31,28,27,35,28,46,24,24,22,31,28,27,31,23,32,36,22,26,34,30,27,25,42,25,37,30.27,31, 30, 48, 28, 24
Construct a frequency nglish-swahili/distribution” target=”_blank”>distribution table having six classes for which 20 is the lowest unit of the first class and 49 is the upper limit of the size of class.
Solution 1
Frequency nglish-swahili/distribution” target=”_blank”>distribution table
| CLASS INTERVAL | FREQUENCY |
| 21-25 | 4 |
| 26-30 | 3 |
| 31-35 | 3 |
| 36-40 | 2 |
| 41-45 | 2 |
| 46-50 | 6 |
edu.uptymez.com
Solution 2
Given:
Class mark(x) = 23, 28, 33
Class size (i) 28-23=5
→1st class interval 23 – 2 = 21
=21
Upper limit 23 + 2 = 25
=25
= 21→25
→2nd class interval
Lower limit = 28 – 2
=26
Upper limit = 28 + 2
=30
= 26→30
→3rd class interval
Lower limit = 33 – 2
= 31
Upper limit = 33 + 2
=35
Others36-40
41-45
46-50
Frequency nglish-swahili/distribution” target=”_blank”>distribution table
| Class interval | Frequency |
| 21-25 | 3 |
| 26-30 | 3 |
| 31-35 | 5 |
| 36-40 | 6 |
| 41-45 | 5 |
| 46-50 | 4 |
| 51-55 | 4 |
| 56-60 | 2 |
| 61-65 | 4 |
| 66-70 | 4 |
| 71-75 | 4 |
| 76-80 | 3 |
| 81-85 | 2 |
| 86-90 | 1 |
edu.uptymez.com
Solution 3
Range(R) = H – C
= 49 – 20
= 29
Also
N=number of class required
N=6
C=
C =
1st class interval
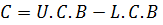
C= U.C.B – L.C.D
C = (U.C.L+0.5)  (L.C.L-0.5)
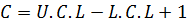
C = U.C.L – L.C.L + 1
5 = U.C.L – 20 + 1
5 = U.C.L – 19
U.C.L = 24
→20-24
Other intervals are 25→29, 30→34, 35→39, 40→44, 45→49
Frequency nglish-swahili/distribution” target=”_blank”>distribution table
| Class interval | Frequency |
| 20-24 | 8 |
| 25-29 | 20 |
| 30-34 | 12 |
| 35-39 | 5 |
| 40-44 | 3 |
| 45-49 | 2 |
edu.uptymez.com
II. CUMULATIVE FREQUENCY DISTRIBUTION TABLE
Is the table of class interval with their corresponding Cumulative frequency
Example
| Class interval | 0-9 | 10-19 | 20-29 |
| Cum freq | 3 | 7 | 20 |
edu.uptymez.com
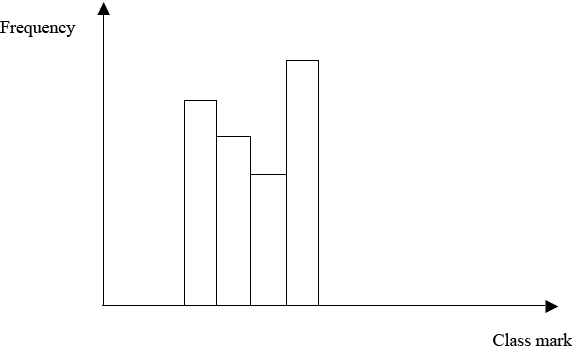
III. FREQUENCY HISTOGRAM
Is the graph which is drawn by using frequencies against class mark
Example
IV) FREQUENCY POLYGON
Is the polygon which is drawn by joining the corresponding points of frequencies against the class marks.
Example;
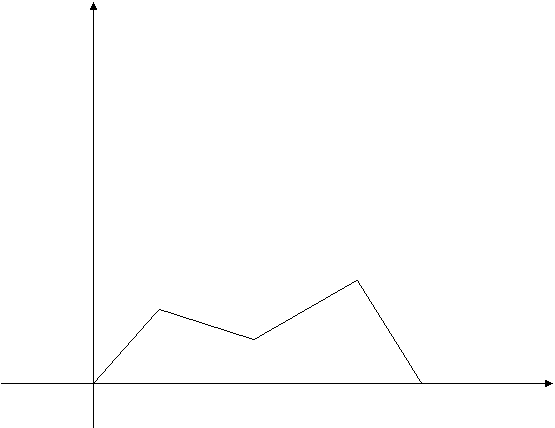 Class mark
Frequency
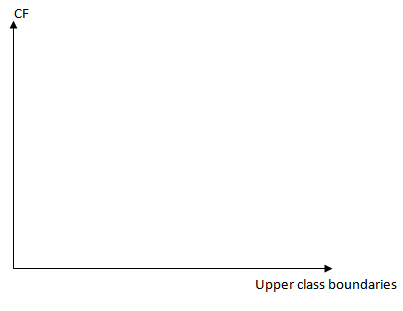
V) CUMULATIVE FREQUENCY CURVE (O GIVE)
Is the curve which is drawn by joining (free hand) the corresponding points of cumulative frequencies against the upper class boundary.
Example;
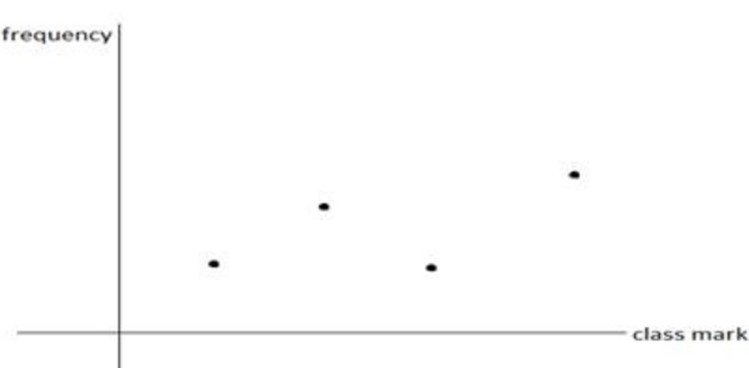
VI) SCATTERED DIAGRAM
Is the diagram where frequencies scattered against class mark without connecting the points.