MEASURES OF GROUPED DATA
These are;
a) Measures of central tendency
b) Measures of dispersion (variability)
c) Measures of position
A.MEASURES OF CENTRAL TENDENCY
These are i) mean
ii) Median
iii) Mode
 I. MEAN (
 )
)
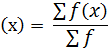
-By direct method
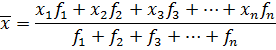
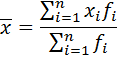
Mean (  )
) 
Where
∑f(x) → is the sum of frequencies times class mark
∑f →sum of frequency
| X | X1 | X2 | X3 | Xn |
| F | F1 | F2 | F3 | Fn |
edu.uptymez.com

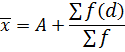
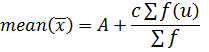
By assumed mean method
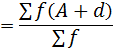
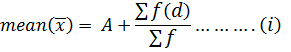
 I.e. mean(x) =
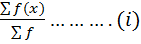
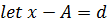
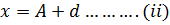
Where
X → is the class mark
A → is the assumed mean
D → deviation
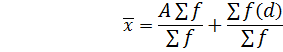
Substitute (ii) into (i)

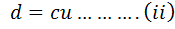
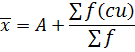
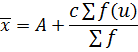
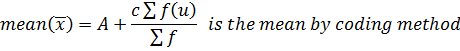
BY CODING METHOD
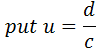
Where;
d → is the deviation
C → is the class size
n → is the coding number
Substitute (ii) into (i)

Examples
1. From the following nglish-swahili/distribution” target=”_blank”>distribution
| X | 10 | 20 | 30 | 40 | 50 |
| F | 16 | 18 | 25 | 19 | 22 |
edu.uptymez.com
Find the mean by
i) Direct method
ii) assumed mean
iii) Coding method
Solution
Consider the nglish-swahili/distribution” target=”_blank”>distribution table
| X | F | F(x) | d= x – a | f(d) | u= |
fu |
| 10 | 16 | 160 | -20 | -320 | -2 | -32 |
| 20 | 18 | 360 | -10 | -180 | -1 | -18 |
| 30 | 25 | 750 | 0 | 0 | 0 | 0 |
| 40 | 19 | 160 | 10 | 190 | 1 | 19 |
| 50 | 22 | 1100 | 20 | 440 | 2 | 44 |
 |
 |
 |
 |
edu.uptymez.com
Let A = Assumed mean
= 30
C =Class size
= 10
a) By direct mean method
I.e. Mean (  )
) 

Mean (x) = 25.30
b) By assumed mean method

c) By coding method


MODE
This is the value which occurs most frequently in grouped data mode can be determined by using two methods
a) By estimation from histogram
b) By calculation method
A) MODE FROM HISTOGRAM
-Consider the three bars under consideration of the highest bar with their two adjacent bars from the histogram.
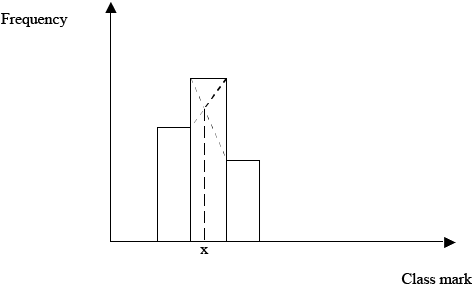
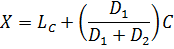
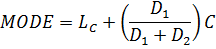
BY CALCULATION METHOD
-Assume that the figure below represents three rectangles of the histogram of the frequency nglish-swahili/distribution” target=”_blank”>distribution of central rectangle corresponding to modal class.
Where
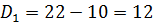
D1 → is the difference between the frequencies of the mode class and the frequency of the class just before the modal class.
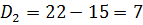
D2 → is the difference between the frequency of the modal class and the frequency of the class just after the modal class
Lc → is the lower class boundary of the modal class
U → is the upper class boundary of the modal class
Hence from the histogram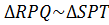


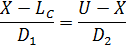
D2(X – LC) = D1 (U – X)
D2 X – D2LC =D1U – D1X
D1X + D2X = D2LC + D1U
X (D1 + D2) = D2 LC + D1U
But
U LC = class size(C)
C= U LC
LC
U = C + LC
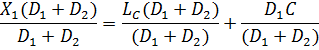
X(D1 + D2 ) = D2LC + D1 (LC+ C)

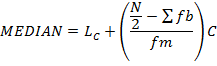
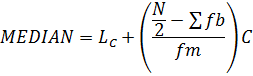
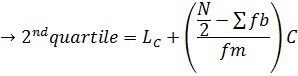
2. MEDIAN
Position of the median class N/2 hence therefore using interpolation

Where;
LC→ is lower boundary of the median class
 → Sum of the frequency before the median class
fm→ frequency of the modal class
c → class size
Example
1. from the following nglish-swahili/distribution” target=”_blank”>distribution table
| Class interval | Frequency | Comm. freq |
| 1-7 | 8 | 8 |
| 8-14 | 10 | 18 |
| 15-21 | 22 | 40 |
| 22-28 | 15 | 55 |
| 29-35 | 7 | 62 |
| 36-42 | 18 | 80 |
edu.uptymez.com
Find i) mode
ii) Median
2. Find the mean and the median o the following nglish-swahili/distribution” target=”_blank”>distribution
| Class interval | Frequency |
| 0.20-0.24 | 6 |
| 0.25-0.29 | 12 |
| 0.30-0.34 | 19 |
| 0.35-0.39 | 13 |
edu.uptymez.com
3. Given the frequency nglish-swahili/distribution” target=”_blank”>distribution table below
| Class interval | Frequency |
| 16.50-16.59 | 25 |
| 16.60-16.69 | 47 |
| 16.70-16.79 | 65 |
| 16.80-16.89 | 47 |
| 16.90-16.99 | 16 |
edu.uptymez.com
Solution 1
Consider the nglish-swahili/distribution” target=”_blank”>distribution table
| Class interval | Frequency | Comm. Freq |
| 1-7 | 8 | 8 |
| 8-14 | 10 | 18 |
| 15-21 | 22 | 40 |
| 22-28 | 15 | 55 |
| 29-35 | 7 | 62 |
| 36-42 | 18 | 80 |
edu.uptymez.com
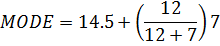
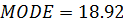
i) mode from the table
Modal class = 15→21
ii) median
Position of median class
=
=40
Median class =15→21
LC= (15 – 0.5)
= 14.5
∑fb=18
Fm=22
C=7
Then
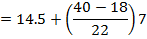
Median = 21.5
MEASURES OF DISPERSION (variability)
These are
i) Variance
ii) standard deviation
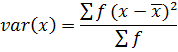
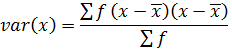
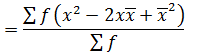
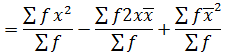
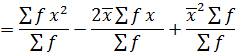
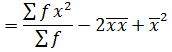
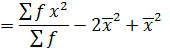
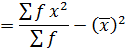
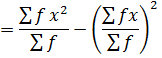
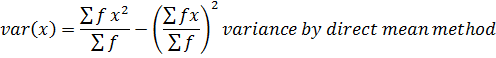
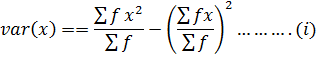
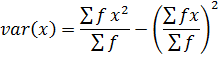
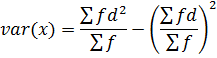
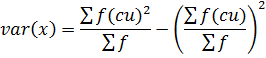
VARIANCE
→Variance by direct mean method
Recall
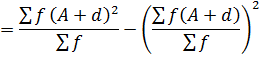
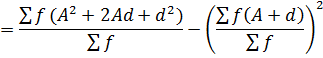
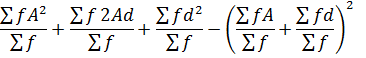
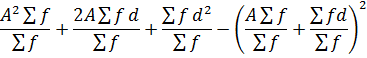
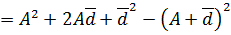
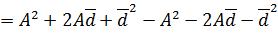
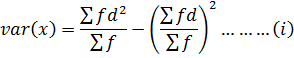
VARIANCE BY ASSUMED MEAN METHOD
Recall
Put X – A= d
X = A + d…… (ii)
Where
X → class mark
A → Assumed mean
Substitute……..ii)………..i) as follows

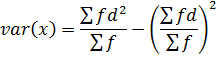
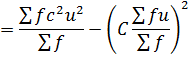
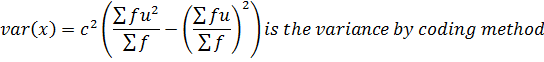
VARIANCE BY CODING METHOD
Recall,
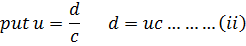
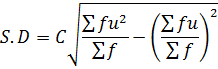
Where;
D = deviation
C = class size
U = coding number
Substitute (ii) into (i)
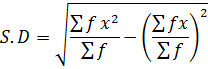
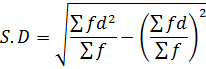
2. STANDARD DEVIATION
This is given by 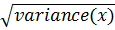
→By direct mean method
→By assumed mean method
→By Coding method
questions
1. Given the nglish-swahili/distribution” target=”_blank”>distribution class interval frequency
| Class interval | Frequency |
| 1-5 | 8 |
| 6-10 | 18 |
| 11-15 | 9 |
| 16-20 | 25 |
| 21-25 | 40 |
edu.uptymez.com
Find the standard deviation by coding method.
2. The table below shows the frequency nglish-swahili/distribution” target=”_blank”>distribution of intelligence quotient (IQ)of 500 individuals
| I.Q | Frequency |
| 82-85 | 5 |
| 86-89 | 19 |
| 90-93 | 32 |
| 94-97 | 49 |
| 98-101 | 71 |
| 102-105 | 92 |
| 106-109 | 75 |
| 110-113 | 56 |
| 114-117 | 39 |
| 118-121 | 28 |
| 122-125 | 18 |
| 126-129 | 10 |
| 130-133 | 6 |
edu.uptymez.com
Using coding method find
i) Mean
ii) Standard deviation
c. MEASURES OF POSITION
These are
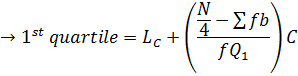
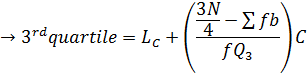
1.quartile
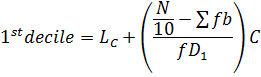
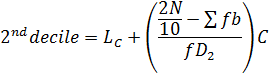
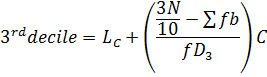
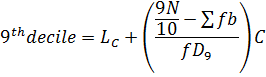
2. deciles
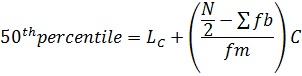
3. Percentile
1.QUARTILE
Recall
2. DECILE
Recall

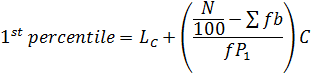
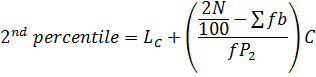
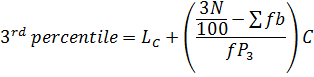
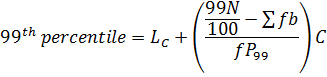
3. PERCENTILE
Recall

Note
2nd quartile 5th, decile and 50th percentile are MEDIANS