Demand Is the willingness and ability of consumer to buy commodity at a given price and specified period of time OR
Demand is the quantity of goods or service that a buyer is willing and able to buy at different prices.
Quantity demanded is the amount of goods a buyer is willing and able to buy at a given price and at a particular time
Demand schedule is a chart or table showing the relationship between quantity demanded and its prices.
Individual demand schedule is the table or chart which shows the relationship of the quantity demanded and prices for one person.
Market demand schedule is the table which shows the relationship between quantity demanded and prices for many persons.
Demand curve is a graphically representation of demand schedule OR
Demand curve is the graph showing the quantity of a commodity demanded at different prices.
From the demand schedule below draw demand curve.
Demand Curve
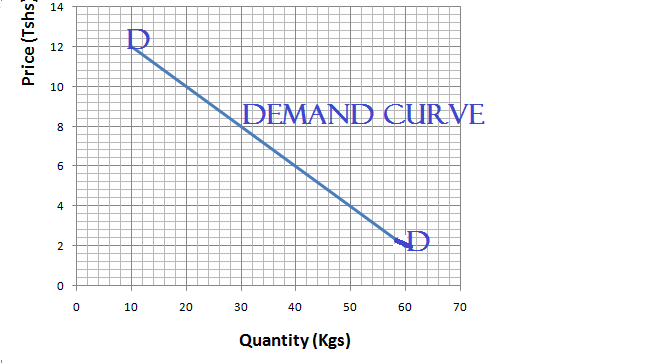
Demand curve (dd) slopes downwards from left to right because as price decreases quantity demanded increase.
Example of market demand schedule
| Price (Tshs) | Quantity demanded by A | Quantity demanded by B | MARKET |
| 100 50 60 40 20 |
50 60 70 80 90 |
0 10 20 30 40 |
50 70 90 110 130 |
edu.uptymez.com
NOTE: (A+ B)=MARKET
TYPES OF DEMAND
There are four types of demand these are;
i/Composite demand
ii/Derived demand
iii/Joint or complimentary demand
iv/Competitive demand
1)COMPOSITE DEMAND
Is a commodity that can meet or can be demanded to satisfy more than one need.
examples
i)steel;can be used to manufacture ship,motor car, machine, knives e.t.c
ii)Water;can be used for
-drinking
-cleaning
-washing
2/DERIVED DEMAND
These are the goods which are demanded for the aim of producing another goods (final goods).
The nature of commodities which have derived demand are inputs such as;
i/Raw material (cotton, sisal)
ii/Fertilizer
iii/Machine
-Fertilizer is demanded in order to produce cotton.maize,beans
-Cotton is demanded in order to produce cloth.
3/JOINT OR COMPLIMENTARY DEMAND
Refers to the commodities which are demanded or consumed together.
Those commodities which can not be separated in their uses.
Example: i/Sugar and tea leaves
ii/Bread and Blue band
iii/Cars and fuel
The above commodities are demanded together.
4/COMPETITIVE DEMAND
These are commodities which are close substitute and have the same utility or satisfaction
If price of one commodity rises, it makes a rise in quantity demanded for another commodity.
Example:
i/Meat vs fish
ii/Coffee vs Tea leaves
iii/ Pepsi vs Coca-cola
THE LAW OF DEMAND
The law of demand states that; The higher the price the lower the quantity demanded and the lower the price the higher the quantity demanded.
Commodity will decrease and when the price is lower the quantity demanded of commodity will increase.
This means, demand have inverse relation with price.
(i) when Px↓→Qd↑
Px↑→Qd↓
where;
P= Price of the commodity
Qd= Quantity demanded of commodity
FACTORS AFFECTING DEMAND
-
Change in the price of a commodity
If the price of a commodity increases then lower amount of that commodity will be demanded and vice versa
-
Change in taste and fashion
The change in taste and fashion will lead to a decreases or increase in demand of a commodity. The choice of a consumer is influenced by age, sex and education.
-
Change in population size
Change of population size affect demand for goods. If there is increase in population size of children in the society the demand for toys will increase and vice versa.
-
Change in income of a consumer
For most cases many goods will be demanded more as the income of the consumer increases at the same price
-
Price of other commodities
This is the change in demand caused by:-
- Close substitute. These are goods which have competitive demand as the price of one product increases it leads to an increase in demand of another product e.g. meat and fish
-
For complementary demand goods.
These are goods which have a joint demanded e.g. petrol and car. An increase in price of one product can lead to a fall in demand of another.
DIFFERENCE BETWEEN CHANGE IN DEMAND AND CHANGE IN QUANTITY DEMAND
Change in demand
Change in demand refers to a shift of the demand curve either from left to right or from right to left. The changes in demand can be caused by the factor which leads to the change in demand for example advertising taste and fashion, population size etc
The change in demand occurs when the price remains constant.
edu.uptymez.com
Decrease in demand
This occurs when the income or taste of consumer or population size falls. It is shown with the shift of demand curve to the left of the original demand curve.
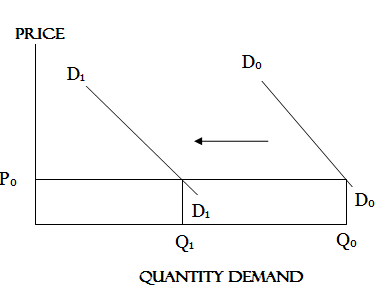
NOTE:
1. DoDo– Shows the original demand curve
2. D1D1– Shows the change in demand from DoDo to D1D1
3. Price (Po)- is constant (No change in price)
4. Demand decrease from Qo to Q1. This occurs when the income, taste, fashion, and population size of the consumers increase or improves. It is shown with the shift of demand curve from the original to the right hand side of the original curve.
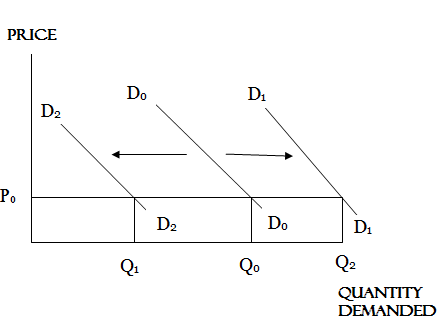
Increase in demand
This occurs when the income or taste of consumer or population size rises. It is shown with the shift of demand curve to the right of the original demand curve.
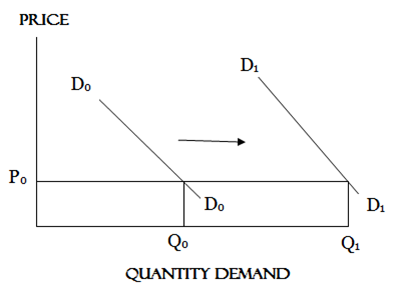
NOTE:
1. DoDo– Shows the original demand curve
2. D1D1– Shows the change in demand from DoDo to D1D1
3. Price (Po)- is constant (No change in price)
4. Demand increase from Qo to Q1
-
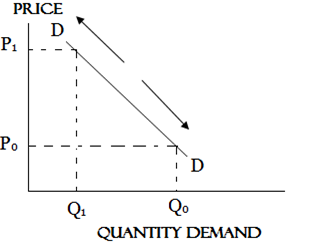
Change in quantity demand
The change in quantity demanded is caused by the change in price while other factors like taste fashion and population size remain constant.
An increase or Decrease in price will cause a change in quantity demanded. This is shown by the movement of the demand curve along the same demand curve.
When the price raises the quantity demanded falls when the price decreases the quantity demanded increases.
NOTE
In change in quantity demand include movement from one point to another while change in demand include shift of demand curve.
-
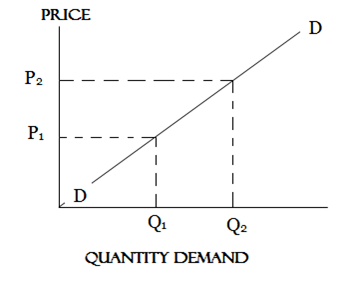
EXCEPTIONAL DEMAND OR ABNORMAL DEMAND CURVE
Abnormal demand curve is that curve which does not obey the law of demand. The demand curve slopes from left to right upward, means that abnormal demand curve has direct relationship with price.