FACTORS CAUSING ABNORMAL DEMAND CURVE
-
Inferior goods or Giffen goods
Some of the cheaper necessary goods such as salt, tomatoes, breads etc sometimes shown an increase in sales it there is an exceptional demand
-
Fear for further increase in price
This is particularly likely happen in period of severe inflation in this situation consumer may buy more of something even though price have risen
-
Luxury goods or Articles of ostentation
These are goods that are disabling by some people even if they are expensive foreign chains and rings made of gold many are bought at higher price.
-
Ignorance of consumer
Sometimes the consumer might buy goods at high price because they are ignorant of lower prices for the same goods in other markets. This normally occurs due to the fact that many consumers do not make a wide research before engaging in buying transactions.
-
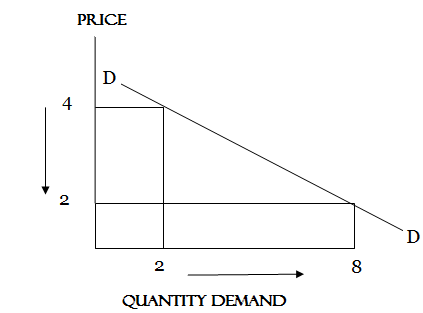
ELASTICITY OF DEMAND
Elasticity of demand or price elasticity is the measure of the degree of responsiveness of change in quantity demand due to change in price of a commodity since the quantity demand of most question how much decreased or increased when price raises or falls. This is measured by the elasticity of demand.
edu.uptymez.com
TYPES OF ELASTICITY DEMAND
- Price elasticity of demand
-
Income elasticity of demand Cross elasticity of demand
- Price elasticity of demand
edu.uptymez.com
Is the degree of responsiveness of change in quantity demand due to change to its price.
MATHEMATICALLY CAN BE SHOWN AS
Elasticity of demand (ED)
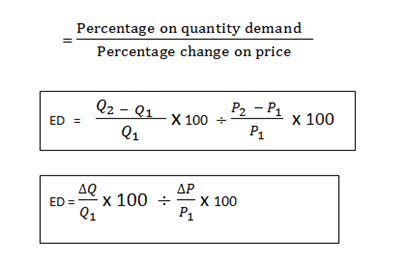
edu.uptymez.com
where;
Δ= Change
Q= Quantity Demand
P=Price
Example;
Give
Find out the elasticity of demand when price raised from 1Tshs to 5Tshs
NOTE
-
If the elasticity of demand is equal to one then known as UNITARY Elasticity
UNITARY ELASTICITY OF DEMAND
edu.uptymez.com
-
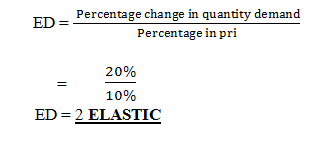
If the elasticity of demand is greater than one (1) is known as ELASTIC
edu.uptymez.com
When the elasticity of demand is less than(1)Its known as IN ELASTIC
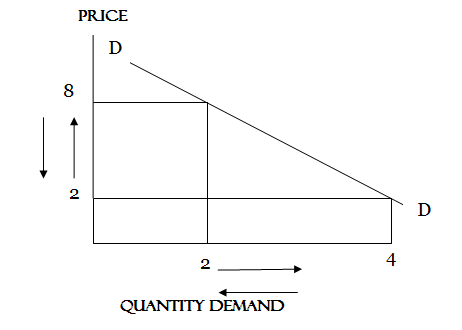
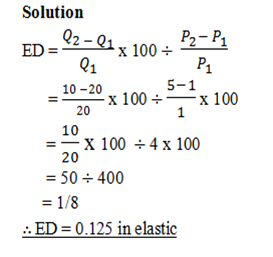
Example
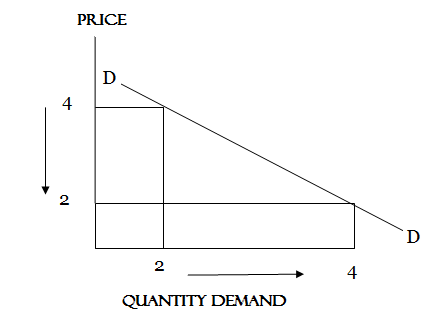
Find the elasticity of demand when price rise by 10% and demand falls by 20%
THEORY OF SUPPLY
Supply; This is the quantity that a sellers is willing and able to sell at given price. Supply implies both willingness and ability to deliver the goods if the price goes down he/she will sell less but if the price goes up he/she will offer more goods for sale.
SUPPLY SCHEDULE
This is table showing the quantity of a commodity that will be supplied over a range of price.
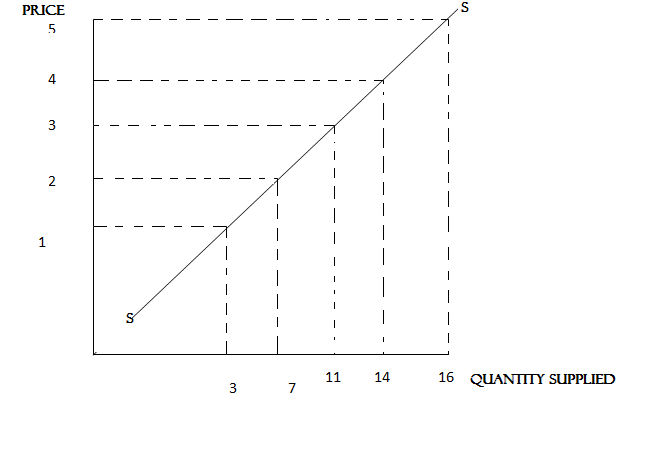
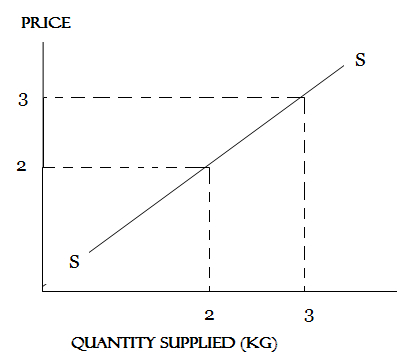
SUPPLY CURVE
This is a graphically representations of the supply schedule. The supply curve slopes upwards to the right because the quantity supplied rises as price rises
THE LAW OF SUPPLY
States that, the higher the price the higher the quantity supplied and vice versa.
OR
States that other things remain constant at the higher price more quantities of goods will be supplied and at lower price quantity supplied of goods decrease.
TYPES OF SUPPLY
- Joint supply
- Composite supply
- Competitive supply
edu.uptymez.com
1. JOINT SUPPLY
Some goods (commodities) are produced together. The supply of these goods which have common process of production are called joint supply or complementary supply. The supply of those goods can increase or decrease simultaneously.
Examples; petrol, diesel, grease, etc. produced together from crude oil.
2. COMPOSITE SUPPLY
Composite supply refers to supply of goods which have close substitute. Example;
– Producer can supply either coffee or tea leaves.
-Can supply Mirinda or Fanta
Therefore the producer has choice to supply variety of goods which have close substitute depending on the availability of resources and cost of producing.
3.COMPETITIVE SUPPLY
If more land is used by wheat production, then the production of maize will decrease the supply of wheat will increase while the supply of maize fall (decrease) given the same price of land.
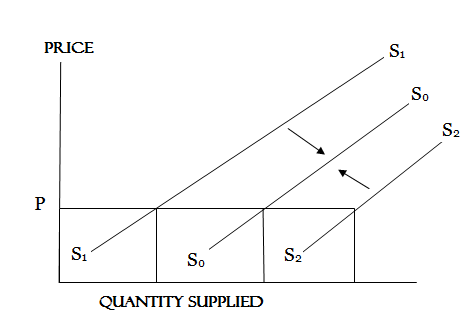
CHANGE IN QUANTITY SUPPLIED
Change in quantity supplied means increase or decrease in quantity supplied due to change in price when other factors remain constant.

CHANGE IN SUPPLY
Change in supply means increase or decrease in supply which caused by other factors when price remain constant.
FACTORS WHICH CAUSE CHANGE IN SUPPLY
1. COST OF PRODUCTION
When production costs are high such as expenses of hiring, workers, purchases of raw materials, producer may incur a lot of cost when cost increase it may lead to the decline of supply of goods and services.
2. LEVEL OF TECHNOLOGY
Adoption of advanced and improved technology may lead to an increase in production and efficiency hence more goods will be supplied in the market example Productivity of farmer who use hoe and animal hoe cannot compare with the one who use tractor.
3. CHANGE IN PRICE OF OTHER COMMODITIES
The rise of price of other comm0dities increase the supply of those commodities and less of the previous commodities. Example, if the price of coffee rises while the price of tea leaves remain constant the producer will produce more coffee and supplied more and produce less tea leaves.
4. CLIMATIC CONDITION
Especially in the field of Agriculture reliable raw Material due to the favourable weather condition may lead to the increase in supply of raw material and lead to increase in Production of agricultural goods (More goods will be supplied at the Market) other side drought, heavy rainfall may destroy the crops and make output fall in supply.
5. IMPROVEMENT OF INFRASTRUCTURE
These means of transportation, communication, education and health services should be reliable to insure high productivity; example in rural areas faced by poor infrastructure which make low productivity.
6. INCENTIVES
These are materials, goods given to workers in order to ennglish-swahili/courage” target=”_blank”>courage them to produce more or to work hard. Example, if producer (employer) motivated his or her workers remain with goods, salaries, health services, education; this necessitable an increase in labour productivity hence supply also increase.
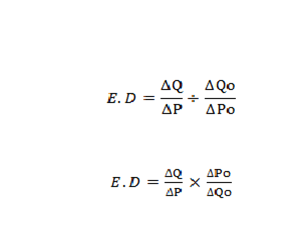
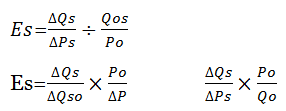
ELASTICITY OF SUPPLY
Is the degree of responsiveness of change in quantity supplied due to change to the price of goods supplied.
OR
Is a change of quantity supplied which caused by change in price.
OR
Is the percentage change in quantity supplied which caused by percentage change in price.
Where
Es= Elasticity of supply
Q= Change in quantity
S= Supply
So= Original supply
FACTORS INFLUENCING ELASTICITY OF SUPPLY
The following are the factors which influence elasticity of supply, these are as follows;
1. NATURE OF COMMODITY
The commodities which are durable can be kept for a long time have a greater elasticity than commodities which are perishable in nature like milk has less elastic supply.
2. COST OF PRODUCTION
The commodities which have too high cost of production have less elastic supply and commodities which have little cost of production have more elastic supply.
3. TIME
The commodities which are produced in a short period of time have greater elasticity than those which are produced in a long period of time.
4. METHOD OF PRODUCTION
The commodities which can be produced with the help of simple method of production have more elasticity and if method of production is complicated supply will be less elastic.
NOTE
Interpretation of price elasticity of supply.
Elastic > 1
Inelastic<1
Unitary=1
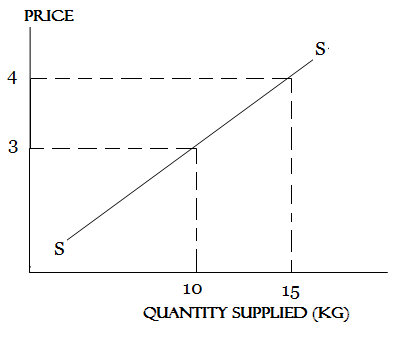
ELASTIC SUPPLY
Is said to be elastic when a percentage change in price brings a large proportionate change in the quantity supplied.
Elasticity is greater than one (Pe>1)
INELASTIC SUPPLY
Is said to be inelastic when a percentage change in price brings a smaller percentage change in quantity supplied.
Inelastic is less than one (Pe<)
UNITARY SUPPLY
Is said to be unitary if a proportional change in price brings an equal proportionate change in quantity supplied.
Unitary is equal to one. (Pe=1)
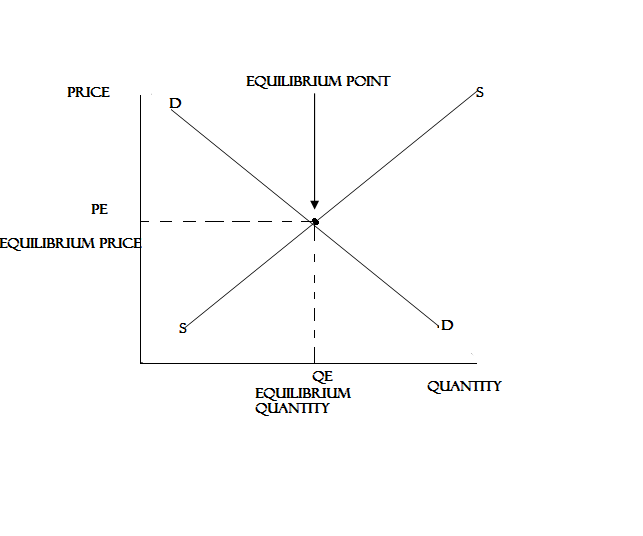
DEMAND AND SUPPLY AT EQUILIBRIUM
EQUILIBRIUM PRICE
Is a price which a buyer is willing to buy and seller is willing to sell.
OR
Is a price which quantity demanded is equal to quantity supplied.
EQUILIBRIUM POINT
It is the point where by the demand curve and supply curve intersect (meet).
EQUILIBRIUM QUANTITY
Is the quantity whereby the quantity demanded is equal to quantity supplied.
Example
From the demand and supply schedule below you’re required to draw the demand and supply curve to shows the equilibrium point
DEMAND AND SUPPLY SCHEDULE
| Price (Tshs) Quantity | Demand (Kgs) | Supply (Kgs) |
| 60 | 200 | 1,400 |
| 50 | 400 | 1,200 |
| 40 | 600 | 1,000 |
| 30 | 100 | 100 |
| 20 | 1,000 | 600 |
| 10 | 1,200 | 400 |
edu.uptymez.com
Therefore
- Equilibrium price = 30/= Tshs
- Equilibrium Quantity =800 Kgs
-
Equilibrium point is “E” occurred where demand and supply curve intersected (Joined)
SOLUTION
DEMAND AND SUPPLY CURVE
edu.uptymez.com
