TIDAL ENERGY
Tidal Power is the power of electricity generation achieved by capturing the energy contained in moving water mass due to tides.
Two types of tidal energy can be extracted: Kinetic energy of currents between ebbing and surging tides and potential energy from the difference in height between high and low tides.
Causes of Tides
Tides are caused by the gravitational pull of the moon, and to a lesser extent the sun, on the oceans. There is a high tide places near the moon and also opposite on the far side.
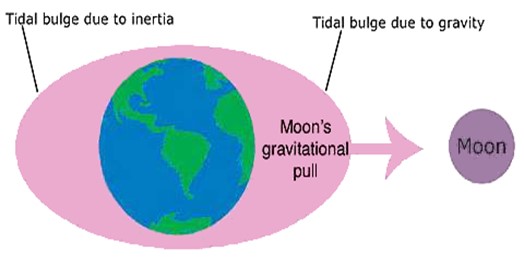
i. High (spring) tide: Occurs when there is full moon. The moon, sun and earth are in line the moon being between earth and sun. The pulls of the moon and sun reinforce to have extra high tides.
ii. Lowest (neap) tide: Occurs when there is half moon and the sun and moon pulls are at right angles to each other.
iii. Harnessing Tidal Energy
Tidal energy can be harnessed by building a barrage (barrier), containing water turbines and sluice gates, across the mouth of river. Large gates are opened during the incoming (flood) tide, allowing the water to pass until high tides, when they are closed.
On the outgoing tide, when a sufficient head of water has built up, small gates are opened, letting the potential energy of the trapped water drive the turbines and generate electricity.
Advantages of Tidal Energy
1. Decrease reliance on coal driven electricity so less CO2 emissions.
2. Changing technology allowing quicker construction of turbines, which in turn increases likelihood of investment with a shorter return.
3. Once constructed very little cost to run and maintain.
4. Tidal energy is renewable and sustainable.
Disadvantages of Tidal Energy
1. Intermittent energy production based around tides creates unreliable energy source.
2. High construction costs
3. Barrages can disrupt natural migratory routes for marine animals.
4. Barrages can disrupt normal boating pathways.
5. Turbines can kill up to 15% of fish in area, although technology has advanced to the point that the turbines are moving slow enough not to kill as many.
Tidal Power
If the tidal height (level) is h and the estuary area is A, then the mass of water trapped being the barrier is and the centre of gravity is h/2 above the low tide level.
The maximum energy per tide is therefore 
Potential Energy of tide = 
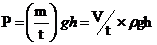
Averaged over a tidal period of T (approx. 12 hours a day), this gives a mean power available of.
Average tidal power =
Note that the efficiency of the turbines (generator) will determine how much of this tidal power will be harnessed.
EXAMPLES: SET B
Example 01
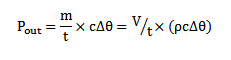
The power output p of a windmill can be expressed as  where A is the area swept out by the windmill blades (sails),
  is the density of air, v is the wind speed and k is a dimensionless constant
(a) Show that the units on both sides of this expression are the same
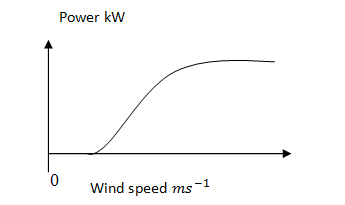
(b) Sketch a graph to show how the power increases with wind speed as v rises from zero to 15ms-1
Solution
(a) Units on L.H.S = Nms-1
Unit on R.H.S. = m2 (kgm-3) x (ms-1)3
= (kgms-2) ms-1=Nms-1
(b)  Variation of power with speed
 0
0
Example 02
The radiation received from the sun at the earth’s surface in a certain country is about 600 Wm-2 averaged over 8 hours in the absence of cloud.
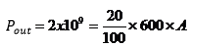
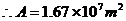
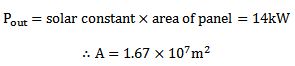
(a) What area of solar panel would be needed to replace a power station of 2.0 GW output, if the solar panels used could convert solar radiation to electrical energy at an efficiency of 20%
(b) What percentage is this area of the total of the country (which is about 3 x 10¹¹m2)?
(c) If the total power station capacity is about 140 GW, what percentage of the surface of the country would be covered by solar panels if all the power stations were replaced?
Solution
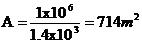
(a) Output of a solar panel
(b) Percentage area to the country
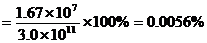
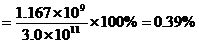
(c) Area of solar panels required

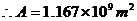
Percentage area to the country
Example 03
(a) What are aerogenerators?
(b) Estimate the maximum power available from 10m2 of solar panels and calculate the volume of water per second which must pass through if the inlet and outlet temperatures are 200C and 700C. Assume the water carries away energy at the same rate as the maximum power available. The specific heat capacity of water is 4200 Jkg-1 and solar constant is 1.4 kWm-2.
Solution
(a) Aerogenerators are devices that convert the kinetic energy of wind into electrical energy. E.g. windmill.
(b) Maximum power available from solar panel
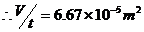
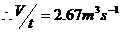
Volume of water per second used is given by
1400 = 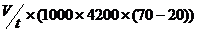
Example 04
A coal – fired power station has an output of 100mW. Given that its efficiency is 45%, how much coal must be supplied each day? Assume 1 tonne of coal gives 3 x 10¹⁰ of energy.
Solution
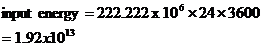
Input power of the station is given by


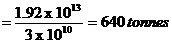
Total input energy in a day is
The amount of coal required is
Example 05
Calculate the energy required transport1000 tones of oil along a 100km pipeline; given that 0.05 kW hours of energy is used to shift each tone of oil along each km of pipeline. Given that 1 tonne of oil releases 4.2 x 10¹⁰ J if burned, what percentage of the total energy available from 1000 tonnes of oil is used to shift the oil along the pipeline? (Ans: 18GJ, 0.043%)
Example 06
A hydroelectric power station has efficiency of 25%. The water driving the turbines falls through a height of 300m before reaching the turbines. Calculate the volume of water that must pass through the turbines each second to give a power output of 2mW. Assume the density of water is 1000kg-3.
Solution
Power of the falling water


But,

Example 07
The solar energy flux near the Earth is 1.4W m-2. A solar power station consists of concave mirrors that focus sunlight onto a steam boiler. What must be the minimum mirror area to given an output 1 mW, assuming 100% efficiency? Why in practice, should the mirror area be greater?
Solution
Minimum mirror area is given by
The mirror area should be greater to achieve such a power output because part of the incident energy is absorbed by the mirror.
Example 08
A solar panel attached to the roof of a house is used to heat water from 50C to 400C. If the water flows through the panel at a rate of 0.012kgs-1 Calculate the heat gained per second by the water. Assume the specific heat capacity of water is 4200Jkg-1K-1. (Ans. 1764 Q)
Example 09
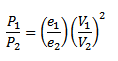
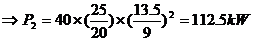
An aerogenerator has a power output that is proportional to (wind speed) 2 and its efficiency varies with wind speed. On a day when there is a steady wind of speed 9 ms-1, the power output is 40kW operating at an efficiency of 20%. If the wind speed on next day is 13.5 ms-1 and the efficiency increases to 25% what is the new power output?
Solution
Power output α efficiency × (wind speed)2
Example 10
Estimate the energy released from a tidal power station if 100 km3 of water raised to height of 1.5m by the tide behind a tidal barrier. What would be the mean power output of such a station if its efficiency is 25% and there are two tides per day?
Solution
The tidal power is given by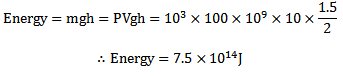
Note that the centre of gravity of water mass is at the half height up.
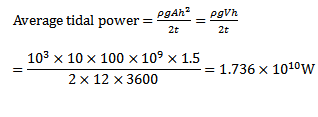
Mean power output is
Example 11
An open boat of width 1.0 m has a total weight of 3000N.Used near a beach, it bobs up and down through 0.5 m once every 5s. Calculate the losses of P.E. every time it drops from a crest to a through. Hence estimate the mean power available per meter of beach waves.
Solution
Loss in P.E. is given by
The mean power available per meter is 300 W
Example 12
(a) If energy is conserved, why is there energy crisis?
(b) Explain the terms high grade and low grade energy and give examples.
(c) Draw an energy flow diagram for a hydroelectric power station. Why does such a station have a much greater efficiency than a thermal power station?
Refer Advanced Physics by Tom Duncan fifth edition for more problems on energy.
GEOPHYSICS
Geophysics is the branch of physics which deals with the study of seismic waves and the Earth’s magnetic and gravity fields and heat flow.
Because we cannot directly observe the Earth’s interior, geophysical methods allow us to investigate the interior of the Earth by making measurements at the surface. Without studying these things, we would know nothing of the Earth’s internal structure.
STRUCTURE OF THE EARTH
Major zones of the earth
The earth is divided into two major zones, namely;
(a) Outer zone, and
(b) Inner zone.
a) Outer zone: the earth’s outer zone consists of;
(i) The hydrosphere – water bodies,
(ii) The atmosphere – gaseous envelope
(iii) The biosphere – living organisms, plant and animals
b) Inner zone: the earth’s inner zone consists of;
(i) The crust – lithosphere
(ii) The mantle – mesosphere,
(iii) The core – barysphere
Atmosphere is the envelope of gases that surround the Earth (oxygen, nitrogen, carbon dioxide, etc)
Hydrosphere is the water bodies filling the depressions in the Earth. Examples are rivers, oceans, seas, oasis, 
Lithosphere is the solid outer most part of the earth.
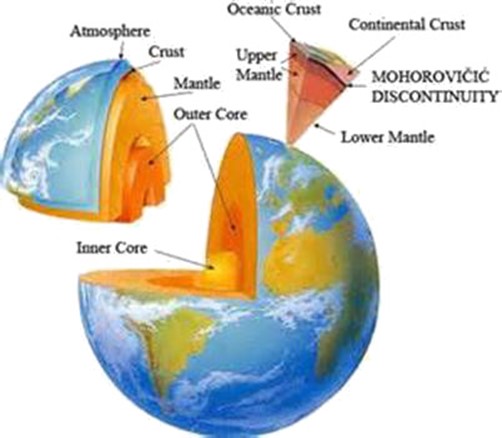
EARTH’S LAYERS
Layers defined by composition
Layers are defined by composition because of density sorting during an early period of partial melting, Earth’s interiors not homogeneous.
Crust – the comparatively thin outer skin that ranges from 3 kilometers at the oceanic ridges to 70 kilometers in some mountain belts. It makes up 1% of the Earth’s volume.
Continental crust (SIAL, Silicon and aluminium)
Average rock density about 2.7 g/cm3
Its density varies between 2.0 to 2.8 g/cm3
Composed of silicon and aluminium
Floats higher on the mantle forming the land masses and mountains. It is 30 to 70 km thick.
Oceanic crust (SIMA), silicon and magnesium)
Oceanic crust ranges from 3 to 15 km thick
Density vary between 3.0 to 3.1 g/cm3
Floats lower on the mantle forming the oceanic basins. It is about 8 km thick.
Mantle – a solid rocky (silica-rich) shell that extends to a depth of about 2900 kilometers. It makes up 83% of the Earth’s volume
The mantle can further be dived into:
(i) Upper layer of mantle (Asthenosphere)
(ii) Transition layer and,
(iii) Lower layer of mantle (Mesosphere)
Upper mantle is a rigid layer of rock with average density 3.3kgm-3
Transition layer is the layer that separates upper and lower mantle.
Lower mantle plays an important role in tectonic plate movement which creates earthquakes and volcanoes.
Its density is about 5.7 kgm-3
Note:
The mantle rocks are said to be in a plastic state.
The upper part of a mantle has a temperature of about 8700C. The temperature increases downwards through the mantle to about 22000C near the core.
Core – an iron – rich sphere having a radius of 3486 kilometers making up 16% of the Earth’s volume
The core is divided into two parts:
(i) Outer core
(ii) Inner core
i. Outer core is a liquid of molten iron and nickel alloys. The Earth’s magnetic field is generated within the outer core due to convective. It is 2270 kilometers thick.
ii. Inner core is a solid iron and nickel alloys. The temperature within the inner core is higher than the outer core but the inner core is solid, this is because higher pressure in this region causes the melting point to rise. It is a sphere of radius of 1216 kilometers.
Average density is nearly 11 gcm-3and at Earth’s center.
Layers defined by physical properties
Lithosphere (sphere of rock)
Earth’s outermost layer
Consists of the crust and uppermost mantle
Relatively cook, rigid shell
Averages about 100 kilometers in thickness, but may be 250 kilometers or more thick beneath the older portions of the continents
Asthenosphere (weak sphere partially molten)
Beneath the lithosphere, in the upper mantle to a depth of about 660 kilometers
Small amount of melting in the upper portion mechanically detaches the lithosphere from the layer below allowing the lithosphere to move independently of the asthenosphere i.e. allows tectonic plate movement.
Mesosphere or lower mantle
Rigid layer between the depths of 660 kilometers and 2900 kilometers
Earth’s major boundaries
Discontinuity is the name given to any surface that separates one layer from another layer of the Earth.
The Moho (Mohorovicic discontinuity)
Discovered in 1909 by Andriaja Mohorovicic
Separates crustal materials (crust) from underlying mantle.
Gutenberg discontinuity
Discovered in 1914 by Beno Gutenberg
Is the boundary between the outer and inner core.
The Earth’s Structure
TEMPERATURE INSIDE THE EARTH
Earth’s temperature gradually increases with an increase in depth at a rate known as the geothermal gradient.
Temperature varies considerably from place to place
Averages between about 200C and 300C per kilometer in the crust (rate of increase is much less in the mantle and core)
The rate of heat flow within the Earth depends on:
(i) The thermal conductivity of the rock,
(ii) Temperature gradient of the rock
Sources of heat Energy within the Interior of the Earth
Major processes that have contributed to Earth’s internal heat include:
1. Heat emitted by radioactive decay of isotopes of uranium (U), thorium (Th), and potassium (K).
2. Heat released as iron crystallized to form the solid inner core.
3. Heat released by colliding particles during the formation of Earth.
4. Gravitational work done by the Earth due to its rotation through its own axis.
5. Electron motion in the core behaves like an electric current.
Heat Lost by the Earth
Heat in the earth is transferred by the process of;
(i) Convection and
(ii) Conduction
In the solid inner core and in the Earth’s crust heat is transmitted by conduction process. Rates of heat flow in the crust vary.
In the Mantle heat is transmitted by conduction process. Rates of heat flow in the crust vary.
In the Mantle heat is transmitted by convection process. There is not a large change in temperature with depth in the mantle.
Mantle must have an effective method of transmitting heat from the core outward.
Transfer of heat in the Earth by mantle convection
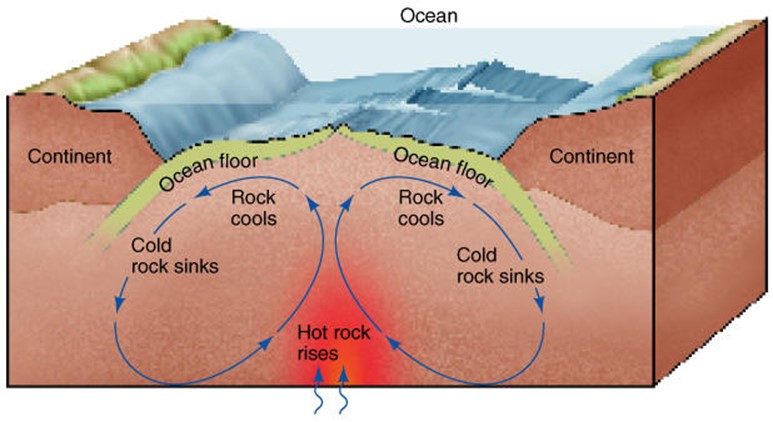
Uses of the Mantle
1. The mantle transfers heat by convection from the earth’s crust to the out regions of the earth and thus help it to regulate its temperature
2. The upper part of the mantle is molten, this allows tectonic plates movements.
EARTHQUAKES
An earthquake is a sudden motion or shaking of the earth caused by a sudden release of energy that has accumulated within or along edges of the earth’s tectonic plates.
Earthquakes occur within the Earth’s crust along faults that suddenly release large amounts of energy that have built up over long periods of time.
The shaking during an earthquake is caused by seismic waves.
Seismic waves are propagating vibrations that carry energy from the source of the shaking (earthquake) outward in all directions.
Seismic waves are generated when rock within the crust breaks, producing a tremendous amount of energy. The energy released moves out in all directions as waves, much like ripples radiating outward when you drop a pebble in a pond.
CAUSES OF EARTHQUAKES (SEISMIC WAVES)
The main causes of the Earthquakes and so seismic waves are:
1. Movement of tectonic plate.
2. Volcanic activity.
3. Landslide and avalanches.
4. Rebound of the crust.
5. Human activities.
Movement of tectonic plate
The Earth’s crust is made up of segment (layers) called tectonic plates which are slowly drifting in various directions. Tectonic plates may create a fault.
A boundary is a line where two tectonic plates meet.
A geologic fault is a fracture in the earth’s crust causing loss of cohesion and accompanied by displacement along the fracture.
How an earthquake is formed
Tectonic plates grind past each other, rather than slide past each other smoothly. As the plates move past each other they can become locked together due to friction. For some time, they don’t move and strain energy builds up. Stresses builds between them until fractional force holding the plates together give away. The plates move suddenly, releasing the energy and then held again. This sudden jerk is what is felt as an earthquake.
Note
(a) The Earth’s crusts near tectonic plate edges are forced to bend, compress, and stretch due to the internal forces within the earth, causing earthquakes.
(b) Nearly all earthquakes occur at plate boundaries.
Volcanic activity
Molten rock “magma” from the mantle is forced through a weak point in the Earth’s crust creating a volcanic eruption. When magma reaches the Earth’s surface it is known as “Lava”. Successive eruptions leads to the buildup of lava on the sides of the vent creating the familiar “cone – shape” of a volcanoes
Earthquakes may be created by the violent explosions which occur if there are sudden movements of the magma.
Landslides and avalanches
A landslide occurs when a large mass of land slips down a slope. An Avalanche occurs when a large mass of snow pours down a mountain side. Both of these effects can start an earthquake
Rebound of the crust
Elastic rebound theory state that “as tectonic plates move relative to each other, elastic strain energy builds up along their edges in the rocks along fault planes”. Since fault planes are not usually very smooth, great amount of energy can be stored (if the rock is strong enough) as movement is restricted due to interlock along the fault. When the shearing stresses induced in the rocks on the fault planes exceed the shear strength of the rock, rupture occurs.
It follows from this that if rocks along the fault are of a certain strength, the fault is a certain length, and the plates are slipping past each other at a defined rate, it is possible to calculate the amount of time it will take to build up enough elastic strain energy to cause an earthquake and its probable magnitude.
When a fault breaks it release elastic strain energy it stored, and hence earthquake.
Human activities
Human activities such as those caused by nuclear bombs can create earthquake, together with mine actives.
EARTHQUAKE TERMS
Energy released by an earthquake moves outwards from the origin in the form of concentric waves.
Focus (Hypocenter) is the point in the Earth where seismic waves originate.
Epicenter is the point on the earth’s surface vertically above the focus.
Hypocentral distance is the distance between the focus and the seismic detection station.
Epicentral
distance is the distance between the epicentral and the seismic station.
S = Seismic station
E = Epicenter
ES = Epicentral distance
TYPE OF SEISMIC WAVES
i. Seismic waves are elastic waves that propagate within the earth.
There are two type of seismic waves:
1. ii. Body waves, spread outward from the focus in all directions.
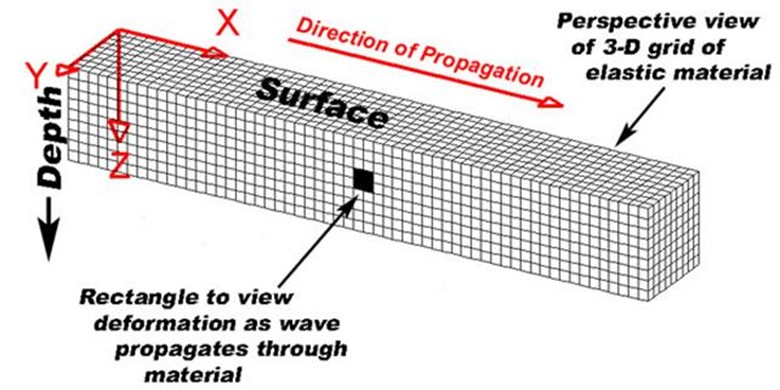
2. iii. Surface waves (Long, L – waves) spread outward from the epicenter to the Earth’s surface along the crust, similar to ripples on a pond. These waves can move rock particles in a rolling motion that very few structures can withstand. These waves move slower than body waves.
BODY WAVES
There are two types of Body Waves
(1) Primary P – wave and
(2) Secondary, S – waves
1. 1. Primary Wave (P – wave): Are longitudinal (compression) wave (travels in the same direction the waves move)
Characteristics of P – waves
1. Are the fastest seismic waves (7 – 14 km/second). Arrives at recording station first, hence the name primary means first.
2. Can pass through solid, gas and liquid, hence can pass through crust, mantle and the cores.
3. Are longitudinal compression waves. The rocks that transmit the P – waves are alternately compressed and expanded.
Velocity of P – waves
The velocity of primary waves depends on the density, bulk modulus B and the shear modulus
In solid, = 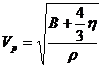
In liquid = 
A fluid cannot support shear stresses hence 
2. Secondary Wave (S – wave): Are transverse (shear) wave (travels perpendicular to the wave movement).
Characteristics of S – waves
1. i. Slower moving (3.5 – 7 km/second) hence are detected after primary waves.
2. ii. Caused by a shearing motion
3. iii. Cannot pass through a fluid (gas or liquid) because they are transverse. Hence are unable to pass through the liquid outer core.
Velocity of S – waves
The velocity of shear waves depends on the density  and the shear modulus
In solid, = 
In liquid = 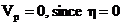
Note: Since the density and states of the earth layers varies, the speed of the seismic waves also vary from layer to layer, the solid part showing greater speed and the liquid ones lower speed.
Primary wave and secondary wave

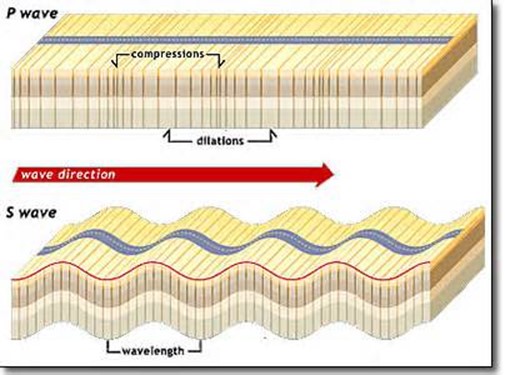
Variation of speed of body waves with depth
SURFACE WAVES/LONG WAVES
Surfaces waves are produced when earthquake energy reaches the Earth’s surface.
These are the slowest moving waves, but are the most destructive for structures on earth
There are two types of L – Waves:
(i) Love long waves
(ii) Rayleigh long waves
i. Love Waves
Love waves are Transverse horizontal motion, perpendicular to the direction of propagation and generally parallel to the Earth’s surface.
They are formed by the interaction of S waves with Earth’s surface and shallow structure and are dispersive waves. The speed at which a dispersive wave travels depends on the wave’s period.
Characteristics of Love Waves
1. i. Love waves are transverse and restricted to horizontal movement (horizontally polarized).
2. ii. The amplitude of ground vibration caused by a Love wave decrease with depth. The rate of amplitude decrease with depth also depends on the period/frequency.
3. iii. Loves wave are dispersive, i.e. wave velocity is dependent on frequency; low frequency – higher velocity.
4. iv. Speed of love waves is between 2.0 and 4.4 km/s
5. v. Love waves travels within the earth’s crust only.
LOVE WAVE
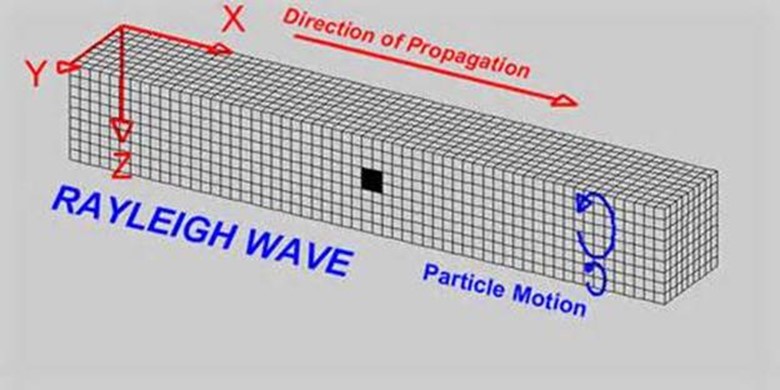
Rayleigh Waves
Rayleigh waves are vertically polarized long waves. The slowest of all the seismic wave types and in some ways the most complicated.
Characteristics of Rayleigh Waves
1. Rayleigh waves are transverse and restricted to vertical movements (vertically polarized).
2. The amplitude of Rayleigh wave decreases with depth. The rate of amplitude decrease with depth depends on the period/frequency
3. Rayleigh wave are dispersive, i.e. wave velocity dependent on frequency; low frequency – high velocity
4. Speed of love waves is between 1.0 and 4.2 km/s slowest of all waves.
5. Travels within the earth’s crust only.
6. Depth of penetration of the Rayleigh waves depend frequency, with lower frequencies, penetrating greater depth.
PROPAGATION OF SEISMIC WAVES
Like all other types of waves, seismic waves may undergo,
(i) Reflection, (ii) Refraction, (iii) Dispersion, (iv) Diffraction, (v) Attenuation.
Seismic reflection:
Seismic waves bounce (reflect) rock boundaries of different rock type (density).
Seismic refraction:
Waves change velocity and direct (refract) when they enter a medium of different density it the one they just passed through.
Seismic Dispersion:
surface waves are dispersive which means that different periods travel at different velocities. The effects of dispersion become more noticeable with increasing distance because the long travel distance spreads the energy out (it disperses to energy).
SEISMIC WAVE PATHS
By comparing the data recorded by many stations all over the world the nature, speed and the paths of the seismic waves can be determined. This information can be used to tell us about the earth’s interior such as density sand state in each layer.
L – Waves travel within the Earth’s crust only
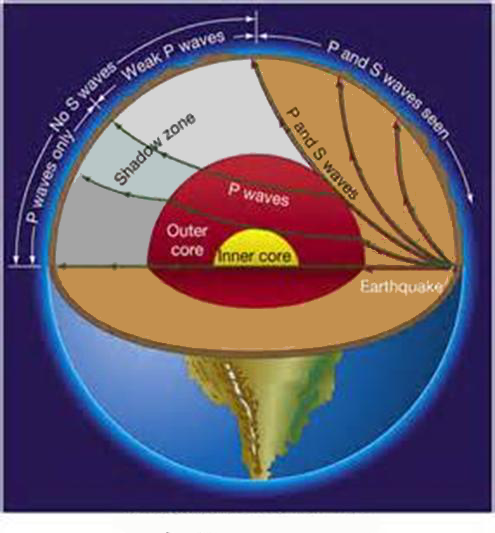
P and S waves travel through the earth in a curve path. The waves are refracted because their speeds a constantly changing with depth due to continue increase in density. Waves are also strongly refracted the Mantle – Core boundary.
Surface waves travels through the Earth crust only
Shadow zone is the region on the Earth’s surface where no S or P waves are present.
This lies between 1050 and 1400. Only surface waves may be detected in this region.
Shadow zone occurs because:
(i) P – Waves are strongly refracted at the liquid outer core.
(ii) S – Waves can’t travel through the liquid outer core.
Seismic waves can also be used to locate the discontinuities in the earth’s crust. A change in density or crack would affect the propagation of the waves.
This alteration in the wave’s path or speed would indicate the discontinuity.
The fact that S waves do not travel through the core provides evidence for the existence of a liquid layer beneath the rocky mantle.
The change in the velocity of P waves at crust – Mantle boundary reveals the presence of Mohorovicic discontinuity
P waves passing through the inner core show increased velocity suggesting that the inner core is solid.
Both P and S – Waves slow down when they reach the asthenosphere. Because of this scientists know that the asthenosphere is partially liquid
MEASUREMENTS OF EARTHQUAKES
i. Seismology is the scientific study of earthquakes (seismic waves) and artificially produced vibrations in the earth.Seismograph is a sensitive instrument that is used to record earthquakes and seismic waves (i.e. ground movements).
ii. Seismogram is the record of ground movement drawn by a seismograph.
The arrival of seismic waves at a station
Seismograph consists of a heavy weight suspended from a frame fixed into the ground. When the earth vibrates the frame moves but the heavy weight remains stationary due to great inertia. A pen attached to weight plots the earth’s movements on a chart recorder to produce a seismogram. To obtain a complete record of the earthquake measurements must be taken in all three planes (x, y and z).
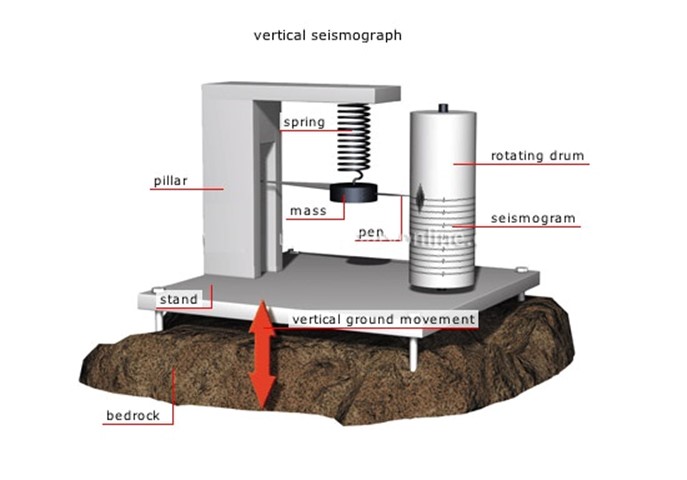
The recording of the motion caused by seismic waves can be done by using;
(a) Mechanical method, as in the drawing above.
( (b) Optical method, where light is used to write the motion on a photosensitive paper instead of using a pen.
(c) Electronic method, where a coil is fixed to the mass of the pendulum and moves in a magnetic field. This induces a voltage which is amplified so that they can be easily interpreted.
Seismometers record both the magnitude and intensity of the earthquake.
LOCATING THE EPICENTRE
Although S – waves, P – waves and surface waves all start out at the same time, they travel at different speeds. The speed of a traveling seismic wave can be used to determine the location of an earthquake epicenter.
A seismograph records the arrival time and the magnitude of horizontal and vertical movements caused by an earthquake. The arrival time between different seismic waves is used to calculate the travel time and the distance from the epicenter.
The difference in arrival time between primary waves and secondary waves is used to calculate the distance from the seismograph station to the epicenter.
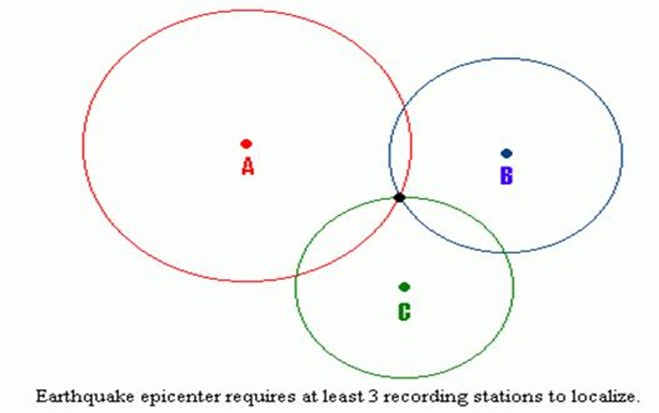
It is crucial that seismic waves are recorded by three different seismograph stations in order to estimate the location of the epicenter.
(i) Locate at least 3 stations on a map that recorded the seismic waves.
(ii) Calculate the time difference between arrival of P – waves and arrival of S – waves from a seismogram. The time difference is proportional to the distance from the epicenter. Because the direction to the epicenter is unknown, the distance defines a circle around the receiving station. The radius of each circle equals that station’s distance from the earthquake epicenter.
(iii) The epicenter is where the circles intersect.
|
|
||
|
|
edu.uptymez.com
|
edu.uptymez.com
SIZE OF AN EARTHQUAKE
The size of an earthquake can be measured in terms of its intensity (Mercalli/Wood Neumann scale) or its magnitude (Richter scale).
Mercalli Intensity Scale
The Mercalli scale measures the intensity of how people and structures are affected by the seismic event. In essence, it measures damage. It is much more subjective and uses numbers ranging from 1 (no damage) to 12 (total destruction).
|
Degree
|
Explanation Detected by a seismograph only |
|
6 |
Felt by all, many frightened. Some heavy furniture moved, some fallen plaster, general damage small |
|
12 |
Total damage, large cracks, waves seen moving through the ground, objects are thrown upwards. |

edu.uptymez.com
ISOSEISMAL LINES
Intensity nglish-swahili/distribution” target=”_blank”>distribution maps can be drawn up showing the intensities of an earthquake over a region. The earthquake is most intense at the epicenter and decreases with distance.
Isoseismal lines are line joining points of equal intensity.
Richter magnitude scale
The magnitude of an earthquake is measured in terms of energy released by an earthquake. This is determined from the amplitude of the seismic wave recorded on a seismogram 100 km from the epicenter. The magnitude is equal to the logarithm of the amplitude. Therefore each successive number represents a tenfold (x10) increase in the ground motion. The Richter scale starts at 0 but has no upper limit. -However 8 represent an earthquake that causes total destruction within the region.
|
Magnitude |
Amount of explosives (TNT) needed to release the equivalent energy, in tons |
|
6 |
6,000 |
|
7 |
180,000 |
|
8 |
5.4 million |
edu.uptymez.com
Intensity of an earthquake is a measure of its strength based on the changes it causes to the landscape.
EARTHQUAKE PREDICTIONS (WARNINGS)
Forecasting (predicting) earthquakes is very difficult, although there are a number of warning signs which occur before an earthquake happens.
(i) Change in the velocity of p – waves.
(ii) Electrical resistivity of the rocks decreases.
(iii) An increase in radon, emission (radon is an inert gas, radon is found to increase in soil and water samples).
(iv) Increase in fore shock (small tumors that occur just before an earthquake).
(v) Local variations in the magnetic field.
(vi) Animals begin to behave strange.
(vii) Water levels rise or fall in wells few days before earthquake.
(viii) Increase in temperature of the area few months before the occurrence of an earthquake
PRECAUTIONS
Some of the world’s populations are living in regions where there is a high risk of an earthquake. Most of these regions lie along fault lines. However a few precautions can be taken to reduce the damage caused.
(a)Build structures that can withstand the forces of an earthquake. One method is to include shock absorbers into the buildings foundations.
(b)Scientific research has shown that pumping water out of the earth reduces the stress in the crust hence preventing an earthquake. However this technique is very expensive.
(c) Stay away from tall buildings or structures during an earthquake if you are outside on occurrence.
(d) If you are inside a house, stay in a safe place where things will not fall on you.
EARTHQUAKE HAZARDS
Earthquake give rises to a number of hazards which pose a great risk to human life, animals, property and the environment at large. The following are some hazards:
1. Landslides and avalanches: The shaking caused by an earthquake can cause unstable hillsides, mountain slops’ and cliffs to move downwards creating landslides. Earthquakes can also trigger avalanches on snow slopes
2. Tsunamis: If an earthquake occurs under the sea or ocean, the shock waves disturb the water. The ocean floor can rise or fall causing the water to rise and fall too. This movement creates huge water waves called tsunamis that travel across the ocean.
3. Collapsing building: Buildings or structures may collapse during a strong earthquake. The collapse of the building may kill people.
4. Fire outbreak: Earthquakes can cause gas or oil pipes to break and or the collapse of electricity lines. This may set up fire.
5. Backward rivers: Tilting ground due to earthquakes can make rivers change their course.
REFLECTION SEISMOLOGY
This is the study of reflection of seismographic waves by different materials inside the earth.
Applications:
(i) Location of underground oil and water
(ii) Locate discontinuities within the earth
SEISMIC PROSPECTING
Seismic prospecting is the sending of seismic waves into the deep earth’ crust in order to study the structure of the earth or detecting oils or gases in the interior of the earth by utilizing the property of reflection and refraction of the seismic waves.