SUBTOPICS
1. Collection, organization, and presentation of data
2. Measures of central tendency
3. Measures of dispersion
4. Application of statistics
COLLECTION, ORGANIZATION AND PRESENTATION OF DATA
Collection of data
We collect data by
i) Observation
ii) Interview
iii) Questionnaires
iv) Focus group discussion
v) Experiments
vi) Portfolio
Organization of data
We organize data by
i) Rank order list
ii) Frequency nglish-swahili/distribution” target=”_blank”>distribution table
iii) Histogram
iv) Frequency polygon
FREQUENCY DISTRIBUTION TABLE
Is the table which shows data values against their number of occurrence.The number of occurrence are known as the Frequency.
Example
You are given the following data
41,45,62,65,42,41,62,45,71,76,82,92
Prepare the following nglish-swahili/distribution” target=”_blank”>distribution table
Solution
GROUPED DATA
The data within the given interval are grouped together
Example
Prepare the frequency nglish-swahili/distribution” target=”_blank”>distribution table of the following data by using class size of 5:-
41,45,62,65,42,62,45,71,41,76,82,92,48,52,57
Solution
| Class interval | Frequency |
| 41-45 | 5 |
| 46-50 | 1 |
| 51-55 | 1 |
| 56-60 | 1 |
| 61-65 | 3 |
| 66-70 | 0 |
| 71-75 | 1 |
| 76-80 | 1 |
| 81-85 | 1 |
| 86-90 | 0 |
| 91-95 | 1 |
| N=15 |
edu.uptymez.com
PRESENTATION OF DATA GRAPHICALLY AND PICTORIALLY
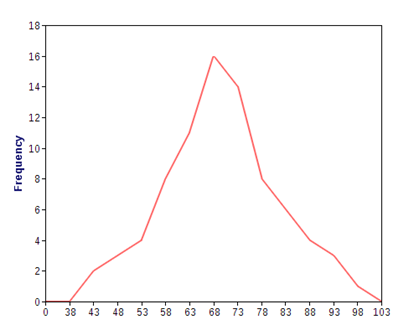
a) FREQUENCY POLYGON
Is the graph of frequency against class mark data values
Example 1
The scores of basic applied mathematics test is given below
| CLASS INTERVAL | FREQUENCY |
| 41-45 | 2 |
| 46-50 | 3 |
| 51-55 | 4 |
| 56-60 | 8 |
| 61-65 | 11 |
| 66-70 | 16 |
| 71-75 | 14 |
| 76-80 | 8 |
| 81-85 | 6 |
| 86-90 | 4 |
| 91-95 | 3 |
| 96-100 | 1 |
edu.uptymez.com
Draw the frequency polygon for the nglish-swahili/distribution” target=”_blank”>distribution
Solution
Procedures
i) Class marks (find)
ii) Plot the graph of frequency against the class marks
iii) Join the points by using a ruler
iv) Add one class below the lowest class interval and assign it with (0) zero frequency
v) Add one class above the highest class interval and assign it with (0) zero frequency
vi) Now join the added classes together with procedure (iii)
| CLASS INTERVAL | FREQUENCY | CLASS MARK |
| 41-45 | 2 | 43 |
| 46-50 | 3 | 48 |
| 51-55 | 4 | 53 |
| 56-60 | 8 | 58 |
| 61-65 | 11 | 63 |
| 66-70 | 16 | 68 |
| 71-75 | 14 | 73 |
| 76-80 | 8 | 78 |
| 81-85 | 6 | 83 |
| 86-90 | 4 | 88 |
| 91-95 | 3 | 93 |
| 96-100 | 1 | 98 |
edu.uptymez.com
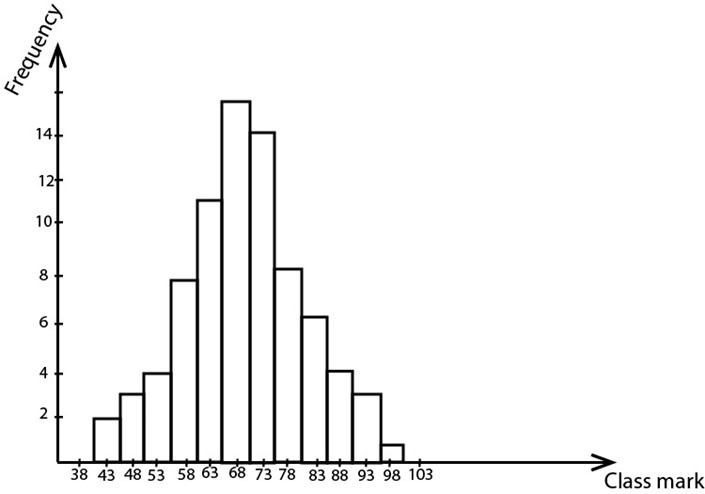
b)HISTOGRAM
Is the graph of frequency against the class mark or data values represented by rectangles.
Example 2:
By using the table in example 1 in the previous page, construct the histogram
Solution
MEASURES OF CENTRAL TENDENCY
a) Mode
Is the data with the highest frequency
Example
50,34,40,52,34,66,41,67,70,81,90,42,35,45
 The mode is 34
THE MODE OF GROUPED DATA
Mode= L + 
Where by
L= Lower boundary of the model class
∆1=Excess frequency of the modal class to the next lower class interval
∆2=Excess frequency of the modal class to the next upper class interval
C= class interval /class size
Example 1
The scores in a geography examination were recorded as follows
| SCORES | 30-34 | 30-34 | 35-39 | 40-44 | 45-49 | 50-54 | 55-59 | 60-64 | 65-69 | 70-79 | 80-84 | 85-89 |
| F | 3 | 5 | 7 | 8 | 16 | 10 | 9 | 8 | 6 | 4 | 3 | 1 |
edu.uptymez.com
Find the mode of the following frequency nglish-swahili/distribution” target=”_blank”>distribution
Solution
Modal class is 50-54
L=49.5
∆1=16-8=8
∆2=16-10=6
C = 5
 Mode = L +
= 49.5 + 
= 49.5 + 
= 49.5 + 
=49.4+2.9
=52.4
b) Median
This is the middle data or middle value
Example
Find the median from the given nglish-swahili/distribution” target=”_blank”>distribution
i) 14, 8, 9, 6,15,16,19
ii) 2,5,6,10,9,7
Solution
i) Arrange the given data in ascending data or descending order
= 6, 8,9,14,15,16,19
 The median is 14
ii) 2,5,6,7,9,10
=  =
=  = 6.5
= 6.5
 The median is 6.5
THE MEDIAN OF GROUPED DATA
Median = L + 
Where by
L=lower boundary of the median class
N=total frequency
na =Total no of frequency below the median class
nm =frequency of the median class
C=class size
Example 2
The scores of a geography examinations data are as the one in example 1
Find the median of the frequency nglish-swahili/distribution” target=”_blank”>distribution
Given data
N=80 N/2=40
Median classes is 55-59
L=54.5, na = 39
nm =10, c=5
Median = L +  c
c
=54.5 + 
=54.5+ 
= 54.5+0.5
= 55
EXERCISE
1. The scores of mathematics subject of 100 students were recorded as follows
Calculate
a) Mode
b) Median score
Solution
a) Mode = L + 
Modal class is 66-70
L = 65.5
 = 34 – 22 = 12
 = 34– 15 = 19
C = 5
= 65.5 + 
= 65.5 + 
=65.5+1.94
= 67.44
b) Median score = L+ 
N=100 N/2=50
Median class is 66-70
L= 65.5, na=34
nm=34, c=5
=65.5 + 
= 65.5+(0.47)5
= 65.5+2.35
= 67.85
2 .The age of children in month were recorded as follows
Calculate the
a) mode
b) Median
Solution
a) Mode = L+  c
c
Modal class is 11-16
l=10.5
∆1=28-26 = 2
∆2=28-18=10
c = 6
= 10.5 + 
= 10.5 + ( 
10.5+ (
=10.5 + 1
= 11.5
b) Median age = L + 
N=100, N/2=50
Median age=11-16
L= 10.5, na =26
nm=28, c=6
= 10.5+ 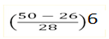
= 10.5+ (0.86)6
=10.5+5.16
=15.66
C.MEAN
Is the ratio of the sum of the data given to the total number of observations.
I.e.  =
=  =
= 
Example
Calculate the mean of the following
33, 40, 44,35,46,50
Solution
 =
=  =
=  =
= 
= 41.3
THE MEAN OF GROUPED DATA
When dealing with grouped data
 =
= 
Where x is the class mark
EXAMPLE
Calculate the mean score of the following nglish-swahili/distribution” target=”_blank”>distribution
Solution
| SCORES | CLASS MARK (x) | f | fx |
| 55-59 | 57 | 5 | 285 |
| 60-64 | 62 | 7 | 434 |
| 65-69 | 67 | 16 | 1072 |
| 70-74 | 72 | 6 | 432 |
| 75-79 | 77 | 4 | 308 |
| 80-84 | 82 | 2 | 164 |
 =40 =40 |
 = 2695 = 2695 |
edu.uptymez.com
Mean=
= 
= 67.38
 = 67.38
ASSUMED MEAN METHOD
The following method is used
X= A + 
Where A= Assumed Mean
f= frequency
d = deviation from assumed mean
N = total frequency
From the same example 3 let it be
Example 4.
Calculate the mean by using assumed mean method
Solution
| SCORES | x | f | d=x-A | fd |
| 55-59 | 57 | 5 | -10 | -50 |
| 60-64 | 62 | 7 | -5 | -35 |
| 65-69 | 67 | 16 | 0 | 0 |
| 70-74 | 72 | 6 | 5 | 30 |
| 75-79 | 77 | 4 | 10 | 40 |
| 80-84 | 82 | 2 | 15 | 30 |
| N=40 |  =15 =15 |
edu.uptymez.com
Take: A =67
 = 67 +
= 67 + 0.38
= 67.38
EXERCISE 2
1. Calculate the mean weight of the following population
| WEIGHT (KG) | 40-44 | 45-49 | 50-54 | 55-59 | 60-64 | 65-69 | 70-74 | 75-79 |
| FREQUENCY | 2 | 5 | 6 | 8 | 6 | 5 | 3 | 2 |
edu.uptymez.com
Solution
Mean = 
| SCORES | CLASS MARK(x) | f | fx |
| 40-44 | 42 | 2 | 235 |
| 45-49 | 47 | 5 | 312 |
| 50-54 | 52 | 6 | 456 |
| 55-59 | 57 | 8 | 372 |
| 60-64 | 62 | 6 | 335 |
| 65-69 | 67 | 5 | 216 |
| 70-74 | 72 | 3 | 154 |
| 75-79 | 77 | 2 | ∑fx=2164 |
edu.uptymez.com
2. Find the mean of the following frequency nglish-swahili/distribution” target=”_blank”>distribution
| SCORES | CLASS MARK(x) | f | fx |
| 85-89 | 87 | 4 | 348 |
| 90-94 | 92 | 14 | 1288 |
| 95-99 | 97 | 32 | 3104 |
| 100-104 | 102 | 28 | 2856 |
| 105-109 | 107 | 17 | 1819 |
| 110-114 | 112 | 5 | 560 |
| 100 | 9975 |
edu.uptymez.com
 =
= 
= 
X= 99.75