THE MEAN BY USING CODING METHOD
PROCEDURES
· Choose the convenient value of x nearby the middle of the range
· Subtract it from every value of x
· Divide by the class size to get the coded value of x i.e. x/c
· Find the product of xc and f i.e. xc f
· Find the mean of xc i.e. 
· Find the true mean
Example
Calculate the mean of the following nglish-swahili/distribution” target=”_blank”>distribution by using coding method
| SCORES | x | f | d=x-A | xc=d/c | xcf |
| 55-59 | 57 | 5 | -10 | -2 | -10 |
| 60-64 | 62 | 7 | -5 | -5 | -7 |
| 65-69 | 67 | 16 | 0 | 0 | 0 |
| 70-74 | 72 | 6 | 5 | 1 | 6 |
| 75-79 | 77 | 4 | 10 | 2 | 8 |
| 80-84 | 82 | 2 | 15 | 3 | 6 |
| N=40 |  =3 =3 |
edu.uptymez.com
A = 67
 =
=  =
=  = 0.075
= 0.075
But  – A =
– A =  .c
.c
 =
=  .c + A
= 0.075 x 5 + 67
= 67.375
EXERCISE
1. By using the coding method calculate the weight of the following population
| WEIGHT(KG | x | f | d=x-A | xc=d/c | xcf |
| 40-44 | 42 | 2 | -15 | -3 | -6 |
| 45-49 | 47 | 5 | -10 | -2 | -10 |
| 50-54 | 52 | 6 | -5 | -1 | -6 |
| 55-59 | 57 | 8 | 0 | 0 | 0 |
| 60-64 | 62 | 6 | 5 | 1 | 6 |
| 65-69 | 67 | 5 | 10 | 2 | 10 |
| 70-74 | 72 | 3 | 15 | 3 | 9 |
| 75-79 | 77 | 2 | 20 | 4 | 8 |
| N=37 |  =11 =11 |
edu.uptymez.com
A = 57
 =
= 
= 
= 0.297
BUT  – A =
– A =  . c
. c
 =
=  .c + A
 = 0.297 x 5 + 57
= 58.486
2. Find the mean of the following frequency nglish-swahili/distribution” target=”_blank”>distribution by using coding method
| Class interval | x | f | d=x-A | xc=d/c | xcf |
| 85-89 | 87 | 4 | -10 | -2 | -8 |
| 90-94 | 92 | 14 | -5 | -1 | -14 |
| 95-99 | 97 | 32 | 0 | 0 | 0 |
| 100-104 | 102 | 28 | 5 | 1 | 28 |
| 105-109 | 107 | 17 | 10 | 2 | 34 |
| 110-114 | 112 | 5 | 15 | 3 | 15 |
| N=100 |  f =55 f =55 |
edu.uptymez.com
A = 97
 =
=
= 
= 0.55
But
 – A =
– A =  . c
. c
 =
=  .c + A
 = 0.55 x 5 + 97
= 2.75 + 97
= 99.75
QUARTILES AND PERCENTILES
QUARTILES
Divides the nglish-swahili/distribution” target=”_blank”>distribution into four (4) equal parts
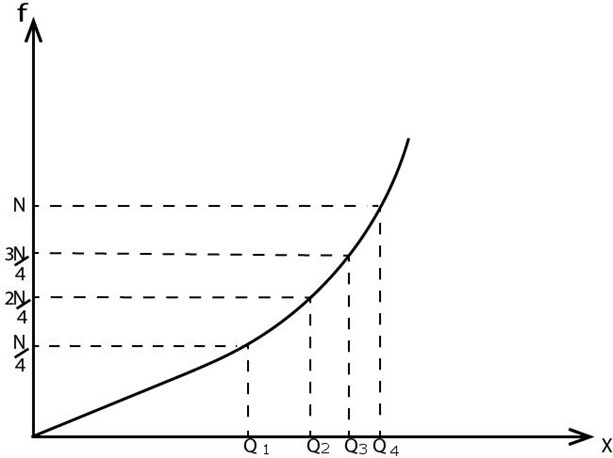
NOTE
i. The value which corresponds to N/4 is called the lower quartile i.e. Q4)
ii. The value which corresponds to N/2 is called the median i.e.(Q2)
iii. The value which corresponds to 3N/4 is called the upper Quartile i.e.(Q3)
iv. The difference between the upper quartile and the lower quartile is known as the inter quartile range
Example
From the following nglish-swahili/distribution” target=”_blank”>distribution find
i) Upper quartile
ii) Lower quartile
iii) Inter quartile range
30,25,66,19,44,45,52,53,37,65,57,44,33,80,76,71,40,50,38,33
Solution
N=20
3/4N=  x 20 = 15
Arranging the value in ascending order
19,25.30,33,33,37,38,40,44,44,45,50,52,53,57,65,66,71,76,80
 The fifteenth value is 57 i.e. the upper quartile is 57
ii) Lower quartile
N/4=20/4=5
 The lower quartile is 33
iii) Inter quartile range
(Upper quartile-lower quartile)
QR =Qu – QL
= 57 – 33
= 24
QUARTILE FOR GROUPED DATA
· Lower quartile (QL)
This is given by
QL = L (L) +  c
c
Where
L (L) =lower boundary of the lower quartile class
N = total number of frequency
na = total frequency below lower quartile class
nc = frequency in the lower quartile class
C = Class size
· UPPER QUARTILE (Qu)
This is given by
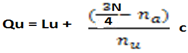
Where
Lu = is the lower boundary of upper quartile class
nu = frequency in the upper quartile class
Example
For the given data below
i) Lower ii) upper quartile iii) inter Quartile range
| SCORES | 11-20 | 21-30 | 31-40 | 41-50 | 51-60 | 61-70 | 71-80 | 81-90 | 91-100 |
| F | 1 | 2 | 7 | 21 | 27 | 22 | 17 | 2 | 1 |
edu.uptymez.com
Solution
i) Lower quartile
QL = Lu +  c
c
N=100
N/4=25
Lower quartile class is 4.50
LL=40.5, na=10, nl=21, c=10
QL = 40.5 +  10
10
QL =40.5+ 
QL=40.5+7.14
QL = 47.64
ii) Upper quartile (Qu)

Lu=60.5, na =58, nu=22, c=10
3/4n=3/4 x 100
Qu=60.5+  10
10
Qu=60.5+ (0.773×10)
Qu=60.5+7.727
Qu=68.227
iii) Inter-quartile range
QR = QU – QL
= 68.227- 47.64 = 20.59
PERCENTILES FOR GROUPED DATA
Percentiles
Divided the nglish-swahili/distribution” target=”_blank”>distribution into hundred (100) equal parts iep1 p2, p3, P4, P5 ……………………….p100
Note
i) The value which corresponds to  is called lower percentile
ii) The value which corresponds to is called the median
iii) The value which corresponds  is called upper percentile
LOWER PERCENTILE (P1)
This is given by:
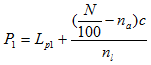
Where
Lp1= Lower boundary of the lower percentile class
N= Total number of frequency
na=Total frequency below lower percentile class
nl= Frequency in the percentile class
c= Class size
Also the upper percentile class is given by
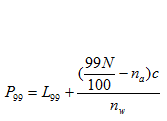
Where
L99= Lower boundary of the upper percentile class
N= Total number of frequency
na=Total frequency below upper percentile class
nw= Frequency in the upper percentile class
c= Class size
Measures of dispersion
The measures of dispersion of a nglish-swahili/distribution” target=”_blank”>distribution are
i) Range
ii) Variance
iii)Standard deviation
THE RANGE
Is the simplest measure of dispersion. The range of a set of data is the difference between the highest and the lowest value
Example
Find the range of the following marks 36, 71, 25 ,93 ,84 ,46, 60, 17, 23,59
Solution
The lowest mark is 17
The highest mark 93
The range is 93- 17= 76
Questions
Describe the following terms with illustrations using the data set
3, 5, 2, 9, 2
(a) Range
(b) Mode
Variance and standard deviation
The standard deviation describe dispersion in term of amount or size by which measurement differ or
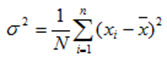
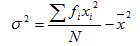
deviate from their mean value. The mean of the squares or the deviation is called VARIANCE denote by that is

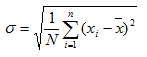
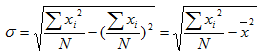
The square root of variance gives by the standard deviation (STD) denoted by That is
In case of frequency nglish-swahili/distribution” target=”_blank”>distribution
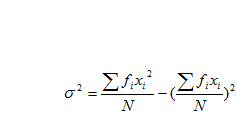
The variance for the grouped data is given by
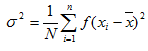 for i = 1, 2, 3……..n
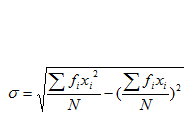
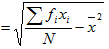
The Standard deviation for the grouped data is given by
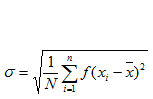 for i = 1, 2, 3……..n
It can be also shown that
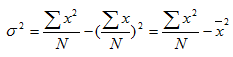
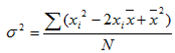
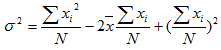
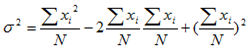
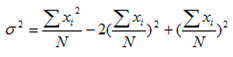
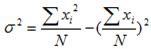
Similarly 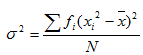 may be written as
The corresponding formulae for the standard deviations are
Where
f is the frequency of each particular value
N is the total number of all frequencies
x is any value in a given set of data is the mean of the of the value
ExampleEvaluate the variance and standard deviation of the following frequency nglish-swahili/distribution” target=”_blank”>distribution:
Solution
To contract the more detailed frequency nglish-swahili/distribution” target=”_blank”>distribution table
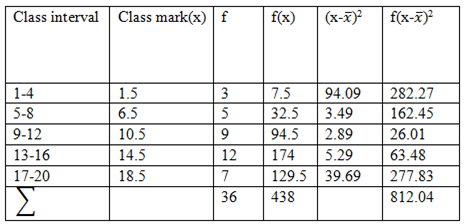
Mean, 
Variance, var(x)=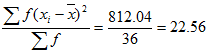
Standard deviation, STD x=
Exercise
1. Calculate the variance and standard deviation of the following nglish-swahili/distribution” target=”_blank”>distribution
2 . Calculate the variance and standard deviation of the following nglish-swahili/distribution” target=”_blank”>distribution
3 The frequency nglish-swahili/distribution” target=”_blank”>distribution table for Msolwa secondary school ground club is a given as
Find the variance and standard deviation
Application of statistics
i) Economics
ii) Business
iii) Agriculture
iv) Health
v) Education
vi) Sport and games
