Concept;
Stock/inventory;
The Tanzania statement of Accounting Guidelines No 2 which deals with the valuation of inventories in the context of the historical cost system states that the term stock/inventories include the following;
- Goods or other assets purchased
- Consumable stores/consumer goods
- Raw materials and components purchased for incorporation in its products for sale
- Products and services in intermediate stages of completion
- Finished goods
- Long-term contract balance
- Farms crops
- Livestock
edu.uptymez.com
CLASSIFICATION AND COST
- Stock taking; Is the process of determining the quantities of all items of merchandize owned by the business firm at the certain date, usually at the end of accounting period. This involves the actual accounting, measure and weighing of all items of unsold merchandize (stock) in the store.
- Inventories/stock is classified as assets (currents) in the balance sheet as it is expected that this stock will be sold and be replaced within one accounting period.
-
Accounting for inventories normally follows the cost concept which means stocks are recorded at acquisition cost or whichever is lower.
NOTE;
edu.uptymez.com
- All items of due stock belonging to the business even those in transit have been included in the inventory figure.
- All items of merchandize (stock) recorded in the inventory list are legally owned by the business.
edu.uptymez.com
STOCK COSTING METHOD
After determining the quantity of merchandize stock at the end of the accounting period, (the balance sheet date) the next step is to assign a cost to each item of merchandize in order to arrive at the value of the ending inventory to be presented in the financial statement
There are two stock/inventory systems which are;
- Perpetual stock system
- Periodic stock system
edu.uptymez.com
Certain assumptions are needed to be made on the flow of goods and their related costs.
- First in first out (FIFO); the assumption is that the oldest items in the stock are the first ones sold. Under this method, the ending inventory is assumed to be comprised of the latest purchases. This is a logical assumption for businesses dealing in perishable goods; FIFO represents a natural flow of merchandize.
- Last in first out (LIFO); the assumption is that, the most recent items in stock are the first ones sold. Example of these is fashionable goods. Under this method the ending stock is assumed to be comprised of the earliest purchases.
-
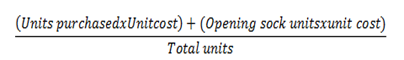
Average cost (AVCO), the stock items has been intermingled, so that the goods sold and the ending stock consists of mixed units. Under this method a weighted average unit cost is calculated for all stock items.
W.A.C= Weighted Average Cost
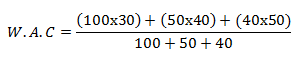
W.A.C = (Total cost purchase + opening stock)/(Total unit)
PERIODIC METHOD
EXAMPLE
Date:purchases
1/1 = 100 units @ 30/=
5/1 = 50 units @ 40/=
10/1 = 40 units @ 50/=
edu.uptymez.com
Sales = 2/1 = 90 units @ 60/=
6/1 = 40 units @ 70/=
11/1 = 30 units @ 50/=
Required: By using periodic method calculate the value of closing stock by FIFO and LIFO
FIFO; total amount of sales → 160=90+40+30
Amount of purchases = 190 units= 100+50+40
Closing stock=190-160=30 units
30 x 50 = 1500
;. Closing stock of FIFO = 1500
NOTE: Closing stock by FIFO will be valued by the last units value to be purchased.
LIFO; Total amount of sales = 160
Amount of purchases → last in first out 190 =100+ 50 + 40
Closing stock = 190-160
30 x 30 = 900
:. Closing stock of LIFO = 900.
NOTE: Closing stock by LIFO will be valued at 30@, the value of list units to be purchased
Workings
Total purchase
1/1/ 100 units @30= 3000
5/1 50 units @ 40= 2000
10/1 40 units @ 50= 2000
7000
Total sales
2/1 90 units @ 60 = 5400
6/1 40 units @70 = 2800
11/1 30 units 50 = 1500
9700
Prepare financial statement for the year/period ending 31Jan.
Note: Using periodic method by FIFO, LIFO and WAC
| FIFO | LIFO | WAC | |
| Sales | 9700 | 9700 | 9700 |
| Less: LOGS | |||
| 7000 (1500) |
7000 (900) |
7000 (1105) |
|
| LOGS | 5500 | 6100 | 5895 |
| Gross profit | 4200 | 3600 | 3805 |
edu.uptymez.com

=36.84
Closing stock value=30 unitsx36.84
=1105
ILLUSTRATION 2
Sinza wholesaler deals in locally made door mats. During 199x, its records show the following transactions related to this particular merchandize.
Stock on hand at 31.12.199x was 70 units (650-580)
Total sales for the year was Tshs.250,000
Using a period inventory system
- First-in first-out (FIFO) method
edu.uptymez.com
The 70 units on hand will be assigned the following costs;
50 x 340 = 17,000 (Nov purchases).
20 x 330 = 6,600 (August purchases).
23,600
Note that in this method it is assumed that the ending inventory consists of units from the most recent purchases
The cost of goods sold will be calculated as follows;
Total purchases 208,000
Less; ending inventory 23,600
Cost of goods sold 184,400
2. Last-in-first-out(LIFO) Method
The 70 units on hand will be assigned to the following costs;
60x 300 = 18,000 (Jan purchases)
10/70 x 310 = 3,100 (March purchases)
21,100
Note that in this method it is assumed that the ending inventory consists of units from the earliest
The cost of goods sold will be calculated as follows;
Total purchases 208,000
Less; Ending inventory 21,100
Cost of goods sold 186,900
3. Average cost (AVCO) method;
This method will use a weighted a average cost for the year calculated as follows;
Weighted Average cost = Total cost of purchases + opening stock
Tshs. 208,000/ = 320/=
650 units
The ending inventory will be assigned this cost which is 70 units @ shs. 320 = 22,400
The cost of goods sold will be;
Total purchases 208,000
Less; ending inventory 22,400
185,600
-Note that the goods sold have the same shs. 320 unit cost (580 units. @ 320= 185,600).
COMPARISON OF INVENTORY COSTING METHOD UNDER PERIODIC SYSTEM
| FIFO | LIFO | AVCO | |
| shs | shs | shs | |
| Sales | 250,000 | 250,000 | 250,000 |
| less ; cost of goods sold | |||
| Purchases | 208,000 | 208,000 | 208,000 |
| less ; Ending inventory | 23,600 | 21,000 | 22,400 |
| 184,400 | 186,900 | 185,600 | |
| 65,600 | 63,100 | 64,400 |
edu.uptymez.com
During the period of rising prices as in this illustration. The FIFO method results in the highest gross profit. This is due to assigning the most recent prices (Higher prices) to the ending inventory. This means the cost of goods sold is assumed to be from the earlier purchases (lower prices).
STOCK LEDGER CARD
II. PERPETUAL SYSTEM OF INVENTORY
-Physical movement of stock.
ILLUSTRATION 3
On 2nd may, M.LTD received 500 units at 20/=
8th may received; 300 units at 22/=
10th issued 400 units at –
15th issued 200 units at –
20th received 600 units at 22/=
25th issued 300 units at –
27th received 200 units at 26/=
30th issued 100 units at –
Standard price for each unit for the month of May was 24/= each, market price of these materials on 3rd June is 27 per unit and 400 units were purchased on that day.
Calculate closing stock under periodic method applying FIFO, LIFO and Average cost (weighted average).
USING A PERPETUAL INVENTORY SYSTEM
- First-in-first-out (FIFO)Method
edu.uptymez.com
A stock record card for the door mats will be maintained as in the next and page.
STOCK CARD
| DATE | PURCHASES/ RECEIVED | SALES/ISSUED | BALANCE | ||||||
| QTY | UNIT COST | TOTAL COST | QTY | UNIT COST | TOTAL COST | QTY | UNIT COST | TOTAL COST | |
| 2-May | 500 | 20 | 10,000 | 500 | 20 | 10,000 | |||
| 8-May | 300 | 22 | 6600 | 300 | 22 | 6600 | |||
| 16,600 | 800 | 16,600 | |||||||
| 10-May | – | – | – | 400 | 20 | 8000 | 100 | 20 | 2000 |
| 300 | 22 | 6,600 | |||||||
| 400 | 8600 | ||||||||
| 15-May | – | – | – | 100 | 20 | 2000 | 200 | 22 | 4,400 |
| 100 | 22 | 2200 | |||||||
| 200 | 4,400 | ||||||||
| 20-May | 600 | 25 | 15,000 | – | – | – | 200 | 22 | 4,400 |
| 600 | 25 | 15,000 | |||||||
| 800 | 19,400 | ||||||||
| 25-May | – | – | – | 200 | 22 | 4400 | |||
| 100 | 25 | 2500 | 500 | 25 | 12,500 | ||||
| 500 | 12,500 | ||||||||
| 27-May | 200 | 26 | 5200 | – | – | – | 500 | 25 | 12,500 |
| 200 | 26 | 5,200 | |||||||
| 700 | 17,700 | ||||||||
| 30-May | – | – | – | 100 | 25 | 2500 | 400 | 25 | 10,000 |
| 200 | 26 | 5,200 | |||||||
| 600 | 15,200 | ||||||||
| Purchases | 36,800 | COGS | 21,600 | 600 | 15,200 | ||||
edu.uptymez.com
2. By LIFO method (Last In First Out)
STOCK CARD
| DATE | PURCHASES | SALES | BALANCE | ||||||
| QTY | UNIT COST | TOTAL COST | QTY | UNIT COST | TOTAL COST | QTY | UNIT COST | TOTAL COST | |
| 2-May | 500 | 20 | 10,000 | – | – | – | 500 | 20 | 10,000 |
| 8-May | 300 | 22 | 6,600 | – | – | – | 300 | 22 | 6600 |
| 800 | 16,600 | ||||||||
| 10-May | – | – | – | 300 | 22 | 6600 | |||
| 100 | 20 | 2000 | 400 | 20 | 8,000 | ||||
| 400 | 8000 | ||||||||
| 15-May | – | – | – | 200 | 20 | 4000 | 200 | 20 | 4,000 |
| 20-May | 600 | 25 | 15,000 | – | – | – | 200 | 20 | 4,000 |
| 600 | 25 | 15,000 | |||||||
| 800 | 19,000 | ||||||||
| 25-May | – | – | – | 300 | 25 | 7500 | 200 | 20 | 4,000 |
| 300 | 25 | 7,500 | |||||||
| 200 | 26 | 5,200 | |||||||
| 700 | 16,700 | ||||||||
| 30-May | – | – | – | 100 | 26 | 2600 | 200 | 20 | 4,000 |
| 300 | 25 | 7,500 | |||||||
| 100 | 26 | 2,600 | |||||||
| 600 | 14,100 | ||||||||
edu.uptymez.com
3.By Average Method
| Date | Purchases/Received | Sales/Issued | Unicost | Balance | |||||
| Cash | Unit cost | Cost | Q | R | Q | R | Cost | ||
| 2 May 8 May |
500 300 |
20 22 |
10,000 6,600 |
500 300 |
20 22 |
10,000 6,600 |
|||
| 800 | 20.75 | 16,600 | |||||||
| 10 May | 400 | 20.75 | 8300 | 400 | 20.75 | 8300 | |||
| 15 May | 200 | 20.75 | 4150 | 200 200 |
20.75 20.75 |
4150 4150 |
|||
| 20 May | 600 | 25 | 15,000 | 600 | 25 | 15,000 | |||
| 800 | 24 | 19,150 | |||||||
| 25 July | 300 | 24 | 7200 | ||||||
| 27 May | 200 | 26 | 5200 | 500 200 |
24 26 |
11,950 5200
|
|||
| 700 | 24.5 | 17,150 | |||||||
| 31 May | 100 | 24.5 | 2450 | ||||||
| PURCHASES | 36,000 | Cost of goods sold | 22,100 | 600 | 24.5 | 14,700 | |||
edu.uptymez.com
14,700= Closing stock